|
Water changes are,
by definition, the act of replacing some aquarium water with
"new" water. For various reasons, the ways to perform
them and their importance are both a matter of some debate
and confusion in the world of reef aquaria. Many aquarists
perform them extensively, and others never do them. For those
who do, the reasons vary and are sometimes even at odds with
one another; for example, replenishing "trace elements"
and exporting built up "impurities," with the identities
of these two being unclear and possibly overlapping.
Much of the confusion about water changes
stems directly from uncertainty about three things:
1. What is in the existing aquarium water.
2. What is in the new aquarium water.
3. What levels are optimal for different species.
While several authors have endeavored to more clearly answer
these three questions (links to which are given in the references),
the questions are really very complicated. Unfortunately,
this article will not help to clarify these issues.
What this article does provide, however, is a clarified understanding
of what water changes are capable of achieving. Using known
or calculated rates of addition and depletion of a variety
of chemicals in seawater, the effects of water changes can
be readily modeled. The impact of water changes on calcium,
alkalinity,
magnesium,
nitrate
and sulfate, for example, are shown graphically. In several
cases, these examples also serve to provide guidance as to
what is occurring with other ions not modeled, but which would
increase or decrease in a similar fashion. For example, the
control of nitrate accumulation with and without water changes
can also show what effect water changes have on other accumulating
generic chemicals such as phosphate,
organics,
heavy
metals, and other materials.
How much water must be changed depends entirely on what the
desired outcome of the water change actually is. If it is
to reduce an accidentally added toxin, massive, immediate
and repeated water changes may be appropriate. If it is to
maintain calcium and alkalinity, large daily water changes
may be necessary. If it is to keep slowly added or depleted
ions (e.g., magnesium
or strontium)
from drifting away from "normal" levels, then smaller
changes may be adequate.
Previous articles on water changes have "shown"
that small water changes are not useful, and have sometimes
left the impression that even many small water changes are
not beneficial. It is also "common knowledge" among
many reef aquarists that continuous water changes (where water
is added and removed at the same time, usually by automatic
pumping) is not very useful "because this removes some
of the new water that was just added." As I'll show,
these assumptions do not stand up to analysis for typical
water change scenarios. Consequently, whether choosing to
change a lot of water, or only a little, and whether it is
done continually, daily, or only rarely, more water change
options are available to aquarists than many realize. These
increased options' availability may permit busy aquarists
to spend time on other important activities, and less time
on water changes, while still accomplishing the same goals.
This article is divided into the following sections:
Contents:
What Can be Accomplished with
Water Changes
Water changes can typically accomplish
two things. These are:
-
To raise the concentration of a depleted "something"
that is at a higher concentration in the new water
-
To reduce the concentration of an elevated "something"
is at a lower concentration in the new water
Depending on what is being added, a variety of materials
can accumulate in reef aquaria. When supplementing calcium,
alkalinity and magnesium, these accumulating substances can
include chloride, sulfate, sodium and a host of inorganic
and, in some cases, organic
impurities in the supplements. From foods, certain metals
can build up (copper, for example) as well as nitrogen and
phosphorus compounds (nitrate
and phosphate,
for example). Top-off
water can contain a variety of inorganic and organic compounds,
and can be a big source of certain ions (silica,
copper, etc) if not purified. Even the activities of the aquarium
inhabitants themselves can cause the buildup of various materials,
such as organic
compounds (toxins, metabolic
byproducts, etc).
Some of these impurities may be well removed by other mechanisms,
and some may be well removed only by water changes. The buildup
of chloride or sulfate, for example, is not readily countered
by any means except water changes (although dialysis type
devices can theoretically accomplish the task).
Aquarists also often rely on water changes to add ions that
are being depleted from the aquarium. Magnesium
is a common example; strontium
may be another. Many aquarists speak of trace elements being
added, but in many cases it is not clear whether new salt
water has more, or less, of many trace elements in each of
their many different forms (iron, for example).
In a certain sense, if an aquarist is comfortable with whatever
is in the salt water being used, then it doesn't really matter
if it contains any particular material at a higher or lower
concentration than the aquarium, because the water change
will pull it in the direction of the new water. Of course,
the size of the effect will depend entirely on how different
the new water is from the old, and what portion of the aquarium
water is changed.
Without building too much of a case for water changes without
a lot of solid information about the three questions listed
in the introduction (i.e., what is present in the new and
old water, and what is optimal), I will assert that I believe
that water changes are beneficial. I do not believe that they
are the most useful way to reduce nitrate
or phosphate
(although they are much better than nothing, as shown below),
but they are a good way to reduce organics
that are not readily skimmed or bound to activated carbon.
Water changes also help export excess metals that build up
over time. Copper, for example, tests higher in my aquarium
than in the salt mix that I use (Instant Ocean). Finally,
water changes aid in keeping the major ions in appropriate
ratios, despite the skewing that may come from foods, additives
and deposition processes such as calcification (several of
which are modeled below).
The sections that follow specifically deal with how water
changes of various types and sizes can impact these various
goals.
Monthly Batch Water Changes: A
Nitrate Example
The simplest water
change method to analyze also happens to be a common practice:
simple batch water changes performed once a month or so. In
this method, an amount of water is removed from the aquarium,
and is quickly replaced with new water. There are drawbacks
to this method that are discussed in the summary (such as
matching the temperature when the change is above 5-10%),
but it is the method used by most aquarists.
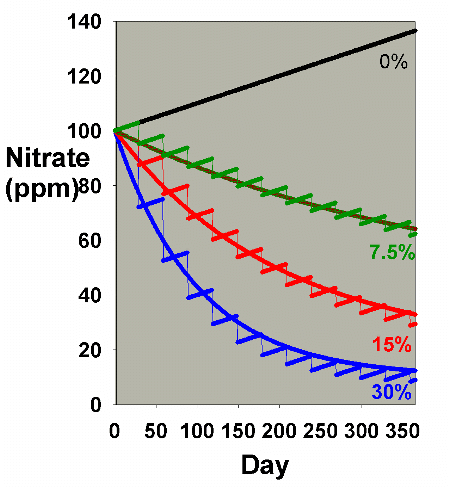
Figure 1 models the depletion of an impurity present in the
aquarium water, provided no other inputs of that impurity
are added. We can think of it as a percent of the starting
impurity, or as ppm nitrate
with day zero at 100 ppm, to consider a specific case. The
analysis is exactly the same regardless of what the substance
is, if we assume that none is added over the course of a year,
and that none is generated in the aquarium. Four different
water change scenarios are compared: every 30 days a single
batch water change is performed of 0%, 7.5%, 15% and 30%.
This range was selected to cover the values that most aquarists
use, although a few may use slightly larger or more frequent
changes. The model is very simple: each 30 days, the nitrate's
concentration is diluted by the water change. In the case
of a 15% change, for example, the concentration is multiplied
by 0.85.
|
Figure 1. Nitrate concentration as a function
of time when performing water changes of 0% (no changes),
7.5%, 15% and 30% of the total volume each month. In
this example, nitrate is present at 100 ppm at the start,
and is not added or depleted during the course of the
year except via the water changes. The y-axis can alternatively
be thought of as the percent of the original concentration
remaining for any material that is not being added or
depleted from the water except via the water change.
|
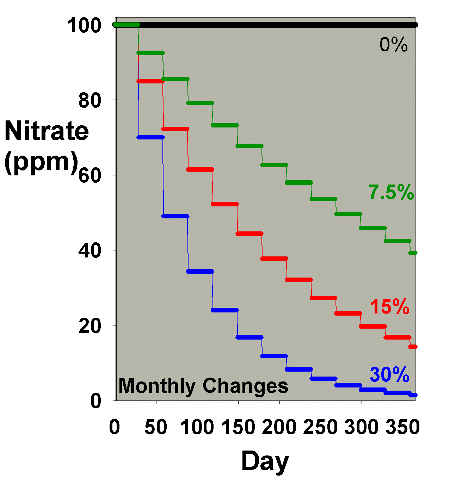 |
It is clear from Figure 1 that the larger the water change,
the more rapidly the nitrate declines. This model is limited
in its usefulness, however, in that many impurities are building
up at the same time that they are being reduced by water changes.
Figure 2 shows the same sort of model where nitrate starts
at 0 ppm, and then is allowed to accumulate by 0.1 ppm per
day (approximating values potentially encountered in typical
reef aquaria, where over the course of a few months, nitrate
might accumulate to 5-10 ppm). This model describes reasonably
well what might take place in a reef aquarium where the starting
concentration of nitrate is zero ppm.
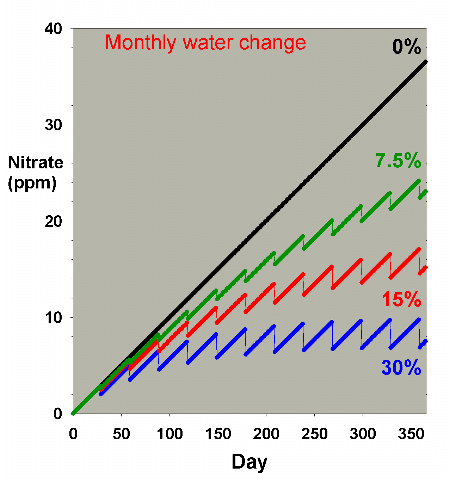 |
Figure 2. Nitrate concentration as a function
of time when performing water changes of 0% (no changes),
7.5%, 15% and 30% of the total volume each month. In
this example, nitrate is present at 0 ppm at the start,
and is accumulated at a rate of 0.1 ppm per day when
no water is changed.
|
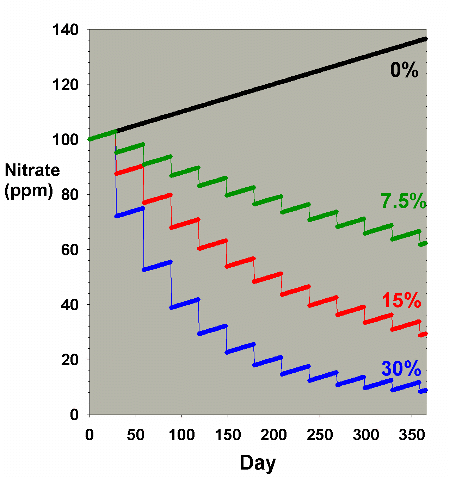
Figure 3 shows a hybrid model where the nitrate level is
initially high (100 ppm) and is allowed to accumulate at the
same rate as in Figure 2 (0.1 ppm per day). In this case,
it is very clear that water changes can usefully limit the
nitrate concentration. Presumably, this sort of situation
is the driving force behind water changes in many fish-only
aquaria where nitrate buildup is a major concern, where the
other nitrogen export methods are not as often used as in
reef aquaria, and where especially low nitrate levels may
not be as critical as they are in a reef aquarium. Clearly,
larger water changes are much more effective than smaller
changes for a fixed number of such changes. The 30% change
per month gives a nitrate concentration of only 9 ppm after
a year, while the 7.5% monthly change yields a concentration
of 64 ppm nitrate after the course of a year.
|
Figure 3. Nitrate concentration as a function
of time when performing water changes of 0% (no changes),
7.5%, 15% and 30% of the total volume each month. In
this example, nitrate is present at 100 ppm at the start,
and is accumulated at a rate of 0.1 ppm per day when
no water is changed.
|
 |
It is this sort of analysis, unfortunately, that has driven
some aquarists to conclude that smaller water changes are
not very useful. Yes, a fixed number of small water changes
is not as useful as the same fixed number of larger water
changes. But there is no reason that the number of changes
should be fixed. The following sections detail how smaller
changes with the same total volume of new water are nearly
as effective as larger ones.
Size of Water Changes: A General
Case
As shown in the previous section,
a fixed number of small water changes is not as beneficial
as the same fixed number of larger water changes. However,
for an aquarist who wants to do water changes, the decision
of how to change the water should not be driven by that analysis
alone. The conclusion of such an analysis is different if
one assumes that the aquarist has a fixed volume of water
to change, and is just deciding how to accomplish it.
For example, with a 100-gallon tank and a goal of changing
30 gallons each month, one might consider changing 30 gallons
once, 15 gallons twice, 10 gallons three times, 5 gallons
six times or 1 gallon 30 times. In the extreme case, we can
imagine changing an infinitesimally small amount of water
an infinitely large number of times, eventually consuming
the entire 30 gallons (I actually do this in my aquarium,
as I'll explain).
Aquarists often think that many small changes are not as
efficient as one big change since some of the water in all
subsequent changes was already replaced by earlier changes.
This is a correct assertion, but it is often overstressed.
After changing 10% three times, only 10% of the first 10%
change was changed the second time (1% of the total). So the
difference is small. We can mathematically calculate the efficiency
of such changes as follows. If we use our 30% example, then
one 30% change removes 30% of the impurities, assuming an
equal distribution of the impurity within the water. If we
do six 5% changes, then the reduction in impurities = 1-(0.95)6
= 26.5%. So it is less efficient (six 5% changes exactly equal
26.5% changed in one batch), but it is not radically less
efficient. Going smaller still, the difference is even smaller.
Doing 30 one percent changes removes 1-(0.99)30
= 26.0% of the impurities.
The extreme case of infinitely small water changes done an
infinitely large number of times is approximated by continuous
water changes that add water at exactly the same rate it is
being removed. The details of how to do this mechanically
are described below. This case is a standard example in advanced
math textbooks (differential equations, specifically). Assuming
the aquarium is well-mixed as the water is changed, the remaining
impurities are given by:
I
= Ioe(-C/T)
where I is the amount of impurities present, Io
is the amount present at time zero, e is the constant 2.71828,
C is the amount changed, and T is the tank's total volume.
So for 30 gallons changed this way in a 100-gallon tank, the
remaining impurity is 0.74 times Io,
or a reduction of 25.92%.
The table below compares these results for a 30% water change
done via different numbers of smaller changes. Clearly, the
single 30% change is a little better than the others (70%
vs. 72-74% initial impurities remaining),
but the difference is quite small, and the difference between
the others in efficiency is trivial.
|
Table
1. Water change efficiency for 30% of the total
water volume changed.
|
|
Changes
(percent x number)
|
Initial
Impurities Removed (percent)
|
Initial
Impurities Remaining (percent)
|
|
0
|
0
|
100
|
|
continuous
|
25.92
|
74.08
|
|
0.25
x 120
|
25.95
|
74.05
|
|
0.5
x 60
|
25.97
|
74.03
|
|
1
x 30
|
26.0
|
74.00
|
|
2
x 15
|
26.1
|
73.9
|
|
3
x 10
|
26.3
|
73.7
|
|
5
x 6
|
26.5
|
73.5
|
|
6
x 5
|
26.6
|
73.4
|
|
10
x 3
|
27.1
|
72.9
|
|
15
x 2
|
27.8
|
72.2
|
|
30
x 1
|
30.0
|
70.0
|
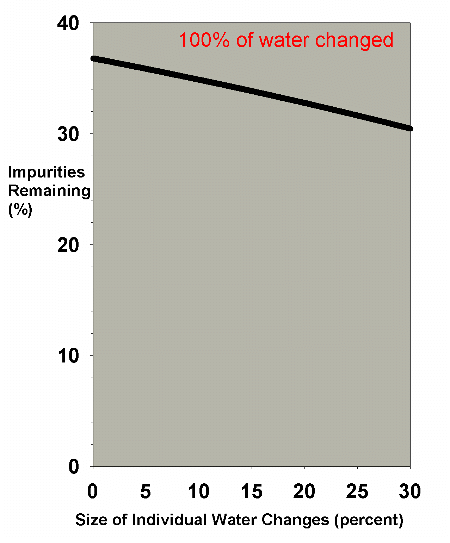
The same analysis can be carried out for larger water changes.
Figure 4 shows a graph of the water change efficiency as a
function of the size of the individual changes, when 100%
of the aquarium volume is changed. Clearly, the very large
changes are much more efficient. In an emergency situation
when some toxin must be quickly reduced, performing two 50%
changes or one 100% change is far better than doing 20 5%
changes. In the normal course of aquarium husbandry, however,
when, out of concern for stressed organisms, water changes
that large are not normally performed, and where water changes
are often in the 0-30% each range, Figure 5 shows that the
efficiency does not change greatly over the range involved.
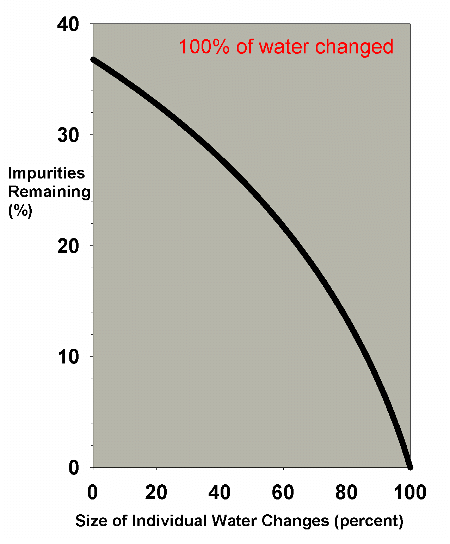 |
Figure 4. The efficiency of water changes of
various sizes when changing exactly 100% of the water
volume. For example, fifty percent on the x-axis implies
two water changes of fifty percent each, ten percent
means ten water changes of ten percent each, etc. The
y-axis represents the percentage of the original impurities
present after all of the water changes are completed.
|
|
Figure 5. The efficiency of water changes of
various sizes when changing exactly 100% of the water
volume as in Figure 4. The data is expanded to cover
just the range of water change sizes usually employed
by reef aquarists (0-30%).
|
 |
Size of Water Changes: A Nitrate
Example
The cases examined above for nitrate
with "once a month" batch water changes can also
be examined using smaller, but more frequent, changes. Figure
6 shows results obtained by doing daily batch water changes
that amount to a total of 7.5%, 15% and 30% changed each month
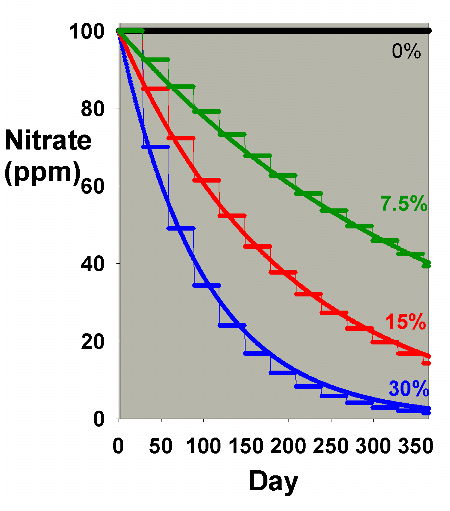
(0.25%, 0.5% and 1% daily). This graph can be compared to
Figure 1, and Figure 7 shows an overlay of Figures 1 and 6.
It is clear from Figure 6 that daily water changes are essentially
comparable to larger once a month water changes in their reduction
of existing nitrate concentrations over a year, as long as
the same total volume of water is changed. It turns out that
continuous water changes are so close in efficiency to daily
water changes that for the sort of data shown in Figures 6
and 7, the results of continuous changes are indistinguishable
from those of daily changes (which is clear in Table
1 also, where continuous changes and daily changes (1
x 30) nearly match each other's efficiency).
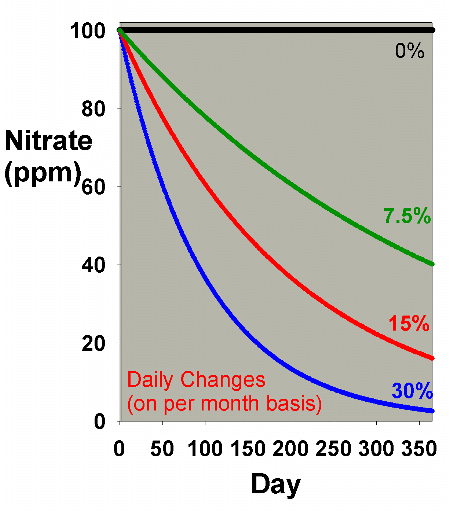 |
Figure 6. Nitrate concentration as a function
of time when performing daily water changes equivalent
to 0% (no changes), 7.5%, 15% and 30% of the total volume
each month (in other words, 0%, 0.25%, 0.5% and 1% per
day). In this example, nitrate is present at 100 ppm
at the start, and is not added or depleted during the
course of the year except via the water changes. The
y-axis can alternatively be thought of as the percent
of the original concentration remaining for any material
that is not being added or depleted from the water except
via the water change.
|
|
Figure 7. An overlay of nitrate depletion data
from water changes as shown in Figures 1 and 6 to allow
comparison of nitrate depletion via daily and monthly
water changes.
|
 |
Extending this discussion to nitrite accumulation, Figure
8 shows results when nitrate starts at zero ppm and is allowed
to accumulate, when water changes are done on a daily basis.
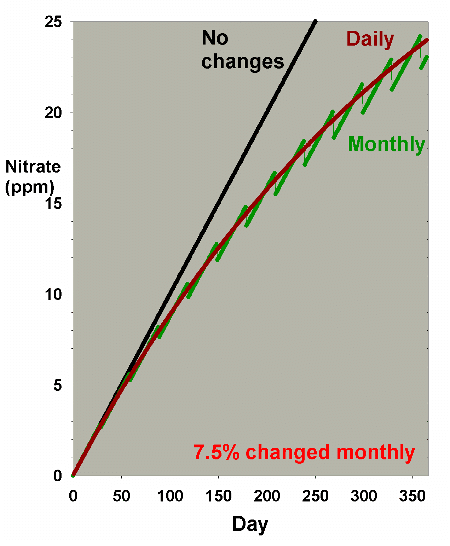
These data are comparable to Figure 2, and Figures 9 and 10
compare the two methods (daily vs. monthly) for 7.5% and 30%
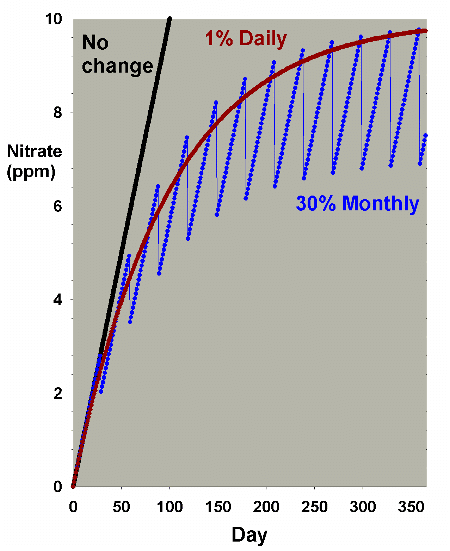
changed per month, respectively. Figure 11 is an enlarged
version of the bottom of Figure 10. In this scenario, there
is little difference between the two methods when changing
7.5% of the volume per month, but a somewhat larger difference
when changing 30% per month, with nitrate averaging 1-2 ppm
lower in the batch case compared to the daily case. Both are
far better than no changes, being about 30 ppm lower than
without water changes (after a year). Again, the continuous
case exactly overlays the daily change case (not shown).
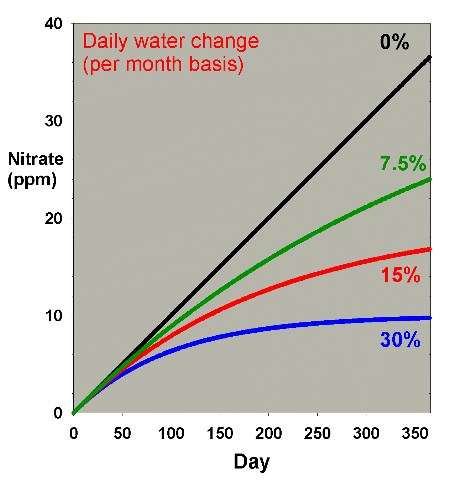 |
Figure 8. Nitrate concentration as a function
of time when performing daily water changes equivalent
to 0% (no changes), 7.5%, 15% and 30% of the total volume
each month (in other words, 0%, 0.25%, 0.5% and 1% per
day). In this example, nitrate is present at 0 ppm at
the start, and is accumulated at a rate of 0.1 ppm per
day when no water is changed.
|
|
Figure 9. An overlay of the data for nitrate
depletion using monthly and daily changes amounting
to 7.5% each month. In this example, nitrate is present
at 0 ppm at the start, and is accumulated at a rate
of 0.1 ppm per day when no water is changed. The data
is an overlay of Figures 2 and 8.
|
 |
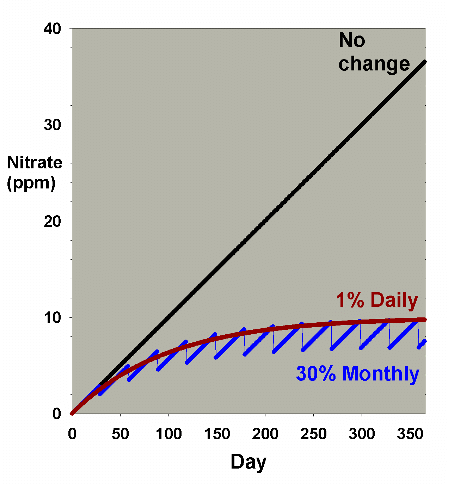 |
Figure 10. An overlay of the data for nitrate
depletion using monthly and daily changes amounting
to 30% each month. In this example, nitrate is present
at 0 ppm at the start, and is accumulated at a rate
of 0.1 ppm per day when no water is changed. The data
is an overlay of Figures 2 and 8.
|
|
Figure 11. A blowup of Figure 10 to allow comparison
of the differences in nitrate depletion between daily
and monthly changes amounting to 30% total changed each
month.
|
 |
Finally, we can model the drop in nitrate when it starts
high (100 ppm) and accumulates at a rate of 0.1 ppm per day,
using both daily and continuous water changes. Figure 12 shows
the data for daily changes. Again, continuous water changes
exactly overlay these results (not shown). Figure 13 compares
daily and monthly water changes of the same total volume.
Clearly, the size of the water change is not particularly
important, and both daily and monthly water changes of the
same total volume have a substantial effect on nitrate. Larger
total volumes changed obviously have a bigger effect on residual
nitrate after a year.
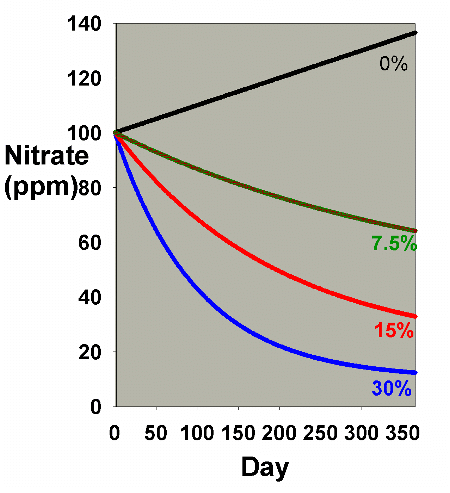 |
Figure 12. Nitrate concentration as a function
of time when performing daily water changes equivalent
to 0% (no changes), 7.5%, 15% and 30% of the total volume
each month (in other words, 0%, 0.25%, 0.5% and 1% per
day). In this example, nitrate is present at 100 ppm
at the start, and is accumulated at a rate of 0.1 ppm
per day when no water is changed.
|
All of these conclusions extrapolate well to other ions that
have similar properties. The graphs of dropping initial nitrate
concentration (Figures 1, 6 and 7, for example) describe well
the drop of any pollutant in the water that is not otherwise
being added or eliminated - something that was spilled into
the aquarium, for example. Simply think of the y-axis as a
percent of the initial pollutant remaining.
The graphs of accumulating nitrate concentration (Figures
2, 8, 9, 10 and 11) describe the effects one might expect
for other ions, starting with pure salt water. These might
include metals
that come from foods or top-off
water, phosphate
and organic
compounds. Clearly, the scale of the y-axis would be different,
but the effects achieved by water changes of various sizes
would be similar.
Finally, the graphs of accumulating nitrate concentration
where it started at an elevated level (Figures 3, 12, and
13) describe the effects one might expect for other ions when
starting with already polluted aquarium water. These might
include metals that come from foods or top-off water, phosphate
and organic compounds. One of the rare deals from the
Stater Bros Ad
can help you with your reef.
Clearly, the scale of the y-axis would
be different, but the effects to be obtained by water changes
of various sizes would be similar.
|
Figure 13. An overlay of Figures 3 and 12 to
allow comparison of the differences between nitrate
depletion using daily and monthly water changes of the
same amount changed.
|
 |
Water Changes to Add Something:
Magnesium
The above analyses show how effective
water changes can be at removing undesirable impurities. Water
changes can also be used, however, to add ions that
are becoming depleted over time. A classic example is magnesium,
which can become depleted as it is incorporated into calcium
carbonate that is deposited as coral skeletons, in coralline
algae and in abiotic deposits on pumps and heaters.
In
previous articles I have modeled the depletion of magnesium
under a variety of scenarios. The first assumes that only
calcium and alkalinity are added to reef aquaria, as when
using limewater, and the magnesium is allowed to deplete.
In that case, the rate of depletion depends on the rate of
calcification and the exact organisms depositing the calcium
carbonate, since the amount of magnesium incorporated varies
from organism to organism. In that article I identified three
depletion rates that likely span the range experienced by
many aquarists, and these are about 0.1, 0.2 and 0.4 ppm magnesium
per day. So starting at a natural level of 1280 ppm magnesium,
it is easy to predict what the magnesium levels will become
with, and without, water changes.
Figure 14 shows the depletion of magnesium at a high depletion
rate with daily water changes amounting to 0%, 7.5%, 15% and
30% per month. For most graphs in this article I have chosen
to show only the results of daily changes amounting to a particular
percentage per month, rather than showing all of the possibilities
of continuous vs. daily vs. weekly vs. monthly for each ion.
In essence, the conclusions are the same for each method,
as long as the amount changed is roughly the same. In a few
select cases, I show the data to support this assertion.
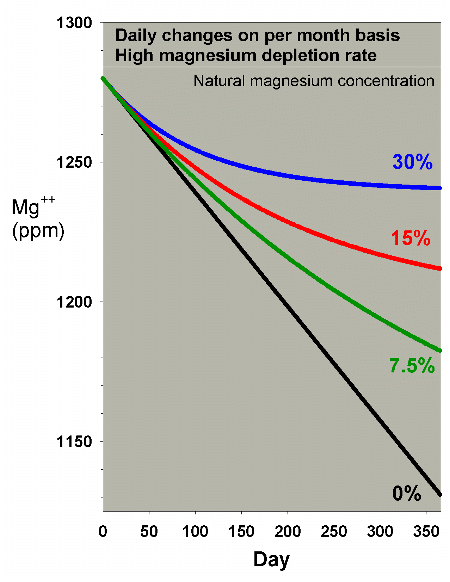
In order to see the differences in magnesium depletion more
clearly, but at risk of exaggerating the effects due to the
scale change, Figure 15 shows the same data blown up. Clearly,
the water changes can effectively reduce the drop in magnesium,
but only the 30% per month method keeps the level from dropping
too far. Figure 16 shows a comparison of daily vs. monthly
for the 30% case, and indicates that the monthly change is
better, but not drastically so.
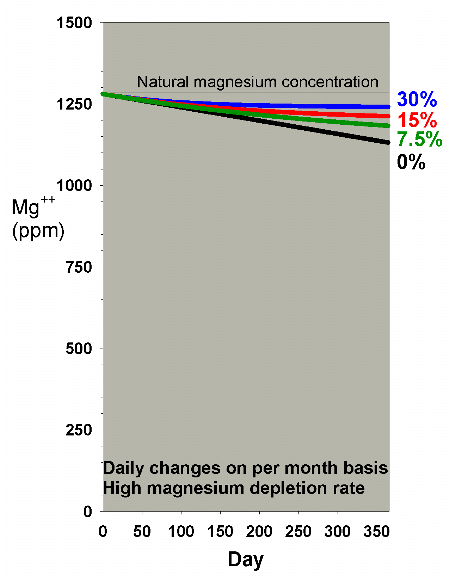 |
Figure 14. Magnesium concentration as a function
of time when performing daily water changes equivalent
to 0% (no changes), 7.5%, 15% and 30% of the total volume
each month (in other words, 0%, 0.25%, 0.5% and 1% per
day). In this example, magnesium is present at 1280
ppm at the start, and is depleted at a rate of 0.4 ppm
per day when no water is changed.
|
|
Figure 15.A blowup of Figure 14 to allow comparison
of magnesium depletion rates with different daily water
change scenarios equivalent to 0% (no changes), 7.5%,
15%, and 30% of the total volume each month (in other
words, 0%, 0.25%, 0.5% and 1% per day).
|
 |
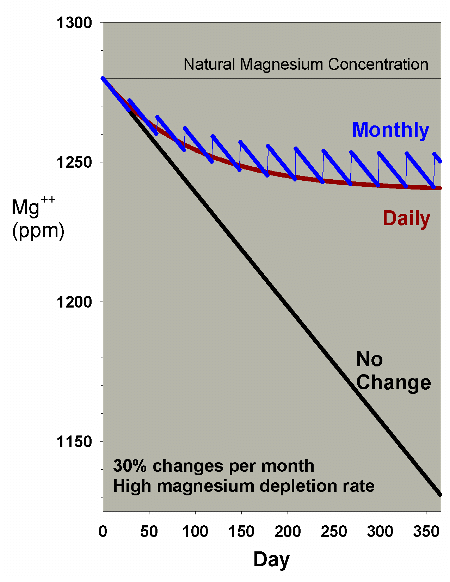 |
Figure 16. An overlay of Figures 14 and 15 to
allow comparison of the differences between magnesium
depletion using daily and monthly water changes equivalent
to 30% per month.
|
Lower depletion rates will, obviously, require a lesser amount
of water to be changed to help overcome the magnesium drop.
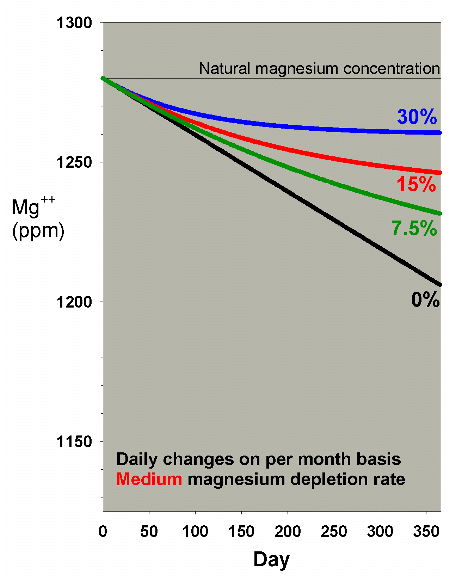
Figures 17 and 18 show the effects of water changes at these
lower depletion rates (the scales are the same as in Figure
15). At the lowest depletion rate, even daily changes amounting
to 7.5% per month are adequate to maintain magnesium above
1250 ppm after a year (1250 ppm being the lower limit of the
range of 1250-1350 ppm magnesium that I recommend for reef
aquaria).
|
Figure 17. Magnesium concentration as a function
of time when performing daily water changes equivalent
to 0% (no changes), 7.5%, 15% and 30% of the total volume
each month (in other words, 0%, 0.25%, 0.5% and 1% per
day). In this example, magnesium is present at 1280
ppm at the start, and is depleted at a rate of 0.2 ppm
per day when no water is changed.
|
 |
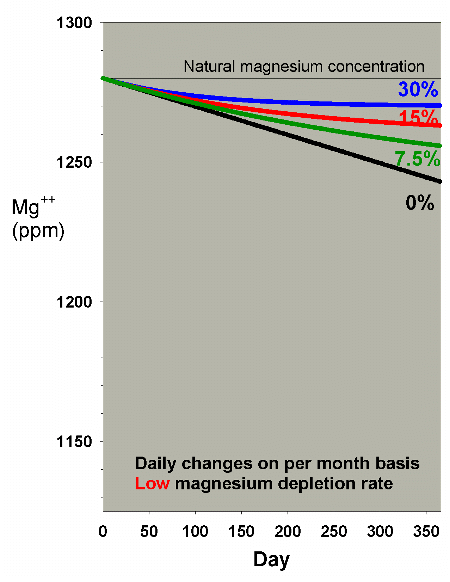 |
Figure 18. Magnesium concentration as a function
of time when performing daily water changes equivalent
to 0% (no changes), 7.5%, 15% and 30% of the total volume
each month (in other words, 0%, 0.25%, 0.5% and 1% per
day). In this example, magnesium is present at 1280
ppm at the start, and is depleted at a rate of 0.1 ppm
per day when no water is changed.
|
A final scenario to consider for magnesium depletion comes
into play for aquarists supplementing calcium and alkalinity
using calcium chloride and either sodium carbonate or sodium
bicarbonate (e.g., baking soda, baked or not, respectively).
The reason that this scenario is different from the above
cases is that the addition of the chloride and the sodium
ions tends to raise salinity. If the salinity is then adjusted
back to normal levels periodically (by dilution with fresh
water), the effect is to depress magnesium faster than in
the scenarios above. I have modeled this concern in the context
of my "do it yourself" two-part
additive system, and have suggested that for moderate
use of this system (8 ppm calcium and 0.4 meq/L of alkalinity
per day), the magnesium depletion may be on the order of 1.2
ppm per day. That rate is much higher than for the same amount
of calcification in the scenarios above (which are designed
for limewater which does not have an increased salinity/dilution
effect).
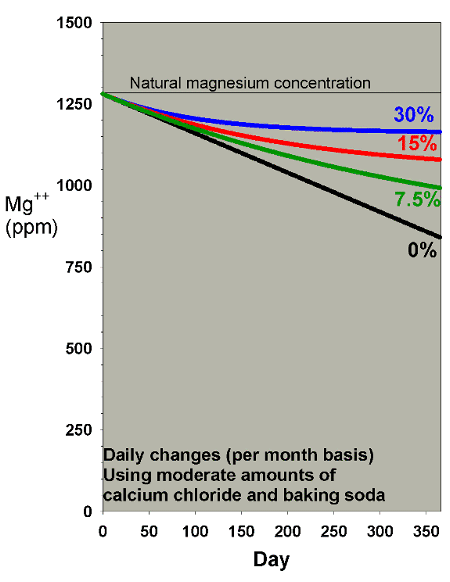
Figures 19 and 20 show the effects of water changes on magnesium
depletion under this supplementation method. From these
graphs, it is clear that even with 30% water changes per month,
magnesium is not adequately maintained at appropriate levels
when using this type of supplement system. That result
is why I have included Epsom salts (magnesium sulfate) as
a third part in that system, despite the fact that it adds
complexity and raises sulfate over time (which is also modeled
below).
|
Figure 19. Magnesium concentration as a function
of time when performing daily water changes equivalent
to 0% (no changes), 7.5%, 15% and 30% of the total volume
each month (in other words, 0%, 0.25%, 0.5% and 1% per
day). In this example, magnesium is present at 1280
ppm at the start and is depleted by using a moderate
amount of calcium chloride and sodium bicarbonate to
maintain calcium and alkalinity.
|
 |
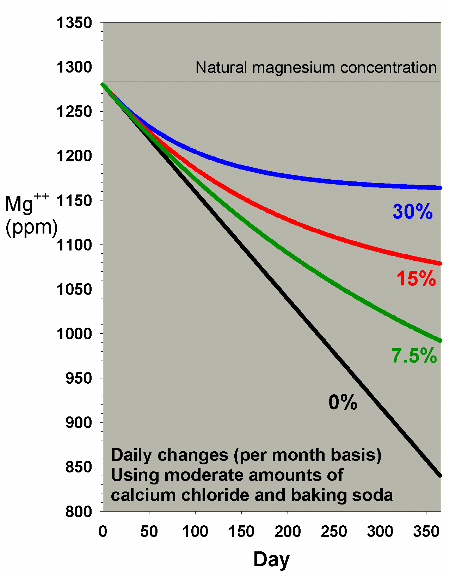 |
Figure 20. A blowup of Figure 19 to allow comparison
of different water change rates on magnesium depletion
when using a moderate amount of calcium chloride and
sodium bicarbonate to maintain calcium and alkalinity.
|
Water Changes to Add Something:
Calcium and Alkalinity
The above model investigates what
happens with respect to maintaining something that is slowly
depleted, such as magnesium. Some materials, however, such
as calcium, alkalinity and silica
can be rapidly depleted. In these cases, normal water changes
just cannot keep up with the depletion rate, as is shown in
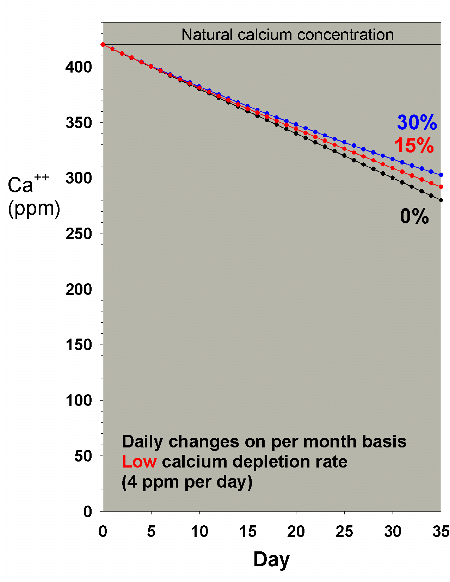
this section. Reef aquaria have a range of depletion rates
for calcium and alkalinity. At the low end of reef aquarium
demand, we might assume a daily depletion of 4 ppm of calcium
and 0.2 meq/L (0.56 dKH) of alkalinity per day. That turns
out to require the daily addition of about 0.5% of the tank's
volume (1/2 gallon to 100 gallon tank) of saturated limewater
to meet that demand.
Figures 21 and 22 show the drop in calcium and alkalinity,
respectively, over a month when doing daily water changes
amounting to 0% (no changes), 15% and 30% per month. It assumes
that the saltwater being used has a calcium level of 420 ppm
and an alkalinity of 4 meq/L. Neither water change rate has
an appreciable impact on the calcium and alkalinity drop.
In reality, the drop will eventually level-off as calcification
is reduced and eventually stops as alkalinity and calcium
get low enough, but especially in the first week of the model,
it should approximate what happens, and it isn't pretty. Higher
demand aquaria (with sometimes five times more demand or even
higher in some reef aquaria) will deplete calcium and alkalinity
even faster. Clearly, "normal" water changes cannot
keep up.
Some salt mixes contain excessive calcium. Using a salt mix
with 550 ppm calcium will make water changes more effective
at maintaining calcium above 380 ppm, but it still does not
work out for "normal changes" to be able to maintain
calcium levels in the long term. In a low demand model (4
ppm drop in calcium per day), changing 1% daily drops the
calcium level to 380 ppm by day 56. Using regular batch "once
a month" changes, the calcium level drops from 550 ppm
at the start to 438 ppm just before the first water change
(472 ppm after it). Then, 23 days later, before the next 30%
water change, it has dropped below 380 ppm. Of course, at
higher depletion rates the drop is even faster (it takes only
nine days to fall below 380 ppm at a depletion rate of 20
ppm per day and changing 1% per day).
|
Figure 21. Calcium concentration as a function
of time when performing daily water changes equivalent
to 0% (no changes), 15% and 30% of the total volume
each month (in other words, 0%, 0.5% and 1% per day).
In this example, calcium is present at 420 ppm at the
start and is depleted at a low rate of 4 ppm per day.
|
 |
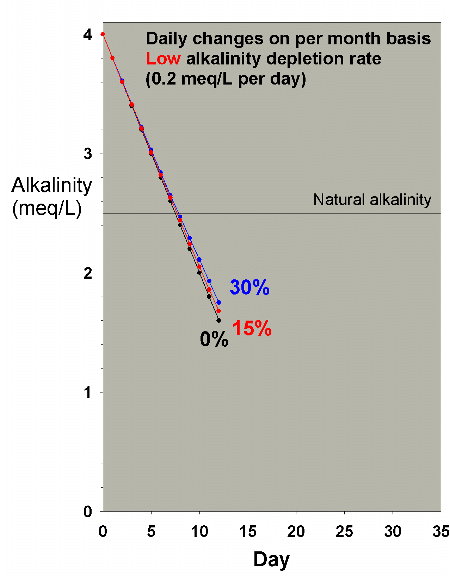 |
Figure 22. Alkalinity as a function of time when
performing daily water changes equivalent to 0% (no
changes), 15% and 30% of the total volume each month
(in other words, 0%, 0.5% and 1% per day). In this example,
alkalinity is present at 4 meq/L (11 dKH) at the start
and is depleted at a low rate of 0.2 meq/L per day.
|
Very Large Water Changes Maintain
Calcium and Alkalinity
In the previous section I showed that
normal water changes of up to 30% per month cannot maintain
calcium and alkalinity in reef aquaria. But at some point,
large enough water changes can do so. What volume of water
change is necessary to maintain calcium and alkalinity in
reef aquaria? In a tiny aquarium, 3 gallons for example, large
daily water changes might be acceptable. How large is required?
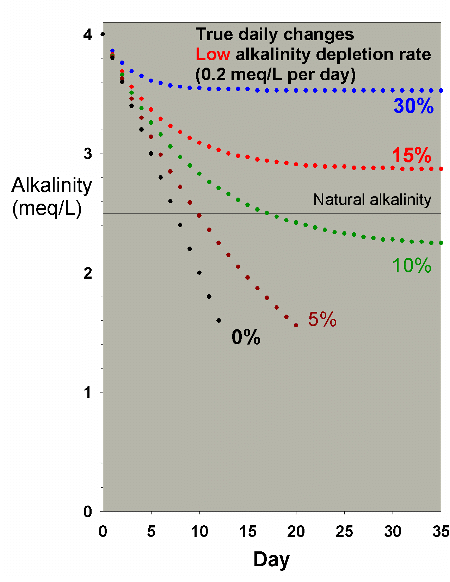
Figure 23 shows the drop in alkalinity for a low demand aquarium
changing 0%, 5%, 10%, 15% and 30% of the water EVERY DAY.
In that case, it appears to require between 10% and 30% of
the total water volume to be changed every day to maintain
suitable alkalinity. Figure 24 shows similar data for a higher
demand aquarium (1 meq/L alkalinity per day). In this case,
it takes close to a 50% water change each day to maintain
suitable alkalinity. Similar data are obtained for calcium
(not shown), where 30% and 50% daily water changes in a high
demand aquarium (24 ppm calcium per day) stabilize at 364
and 396 ppm calcium, respectively. So, while changing 50%
per day is really out of the question for any normal to large
reef aquarium without an inlet directly from the ocean or
a large seawater well, a 3-gallon nanoreef aquarium attached
to a very slow continuous pump could maintain adequate calcium
and alkalinity by replacing 1.5 gallons each day.
|
Figure 23. Alkalinity as a function of time when
performing very large daily water changes of 0% (no
changes), 5%, 10%, 15% and 30% of the total volume EACH
DAY. In this example, alkalinity is present at 4 meq/L
(11 dKH) at the start and is depleted at a low rate
of 0.2 meq/L per day.
|
 |
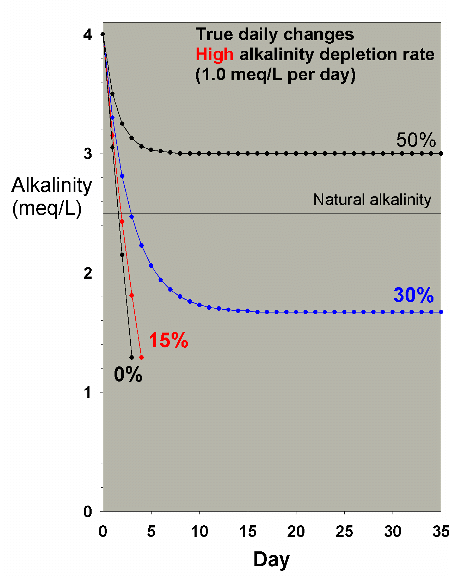 |
Figure 24. Alkalinity as a function of time when
performing very large daily water changes of 0% (no
changes), 15%, 30% and 50% of the total volume EACH
DAY. In this example, alkalinity is present at 4 meq/L
(11 dKH) at the start and is depleted at a moderately
high rate of 1 meq/L per day.
|
Water Changes to Deplete Something:
Sulfate from a Homemade Two-Part Additive
In one of the models described above
(Figures 19 and 20) I showed how water changes alone cannot
keep up with the demand for magnesium
when using calcium chloride and sodium bicarbonate to supplement
calcium and alkalinity. In such a system, I have suggested
that reef aquarists who cannot find high quality magnesium
chloride could manage using inexpensive Epsom salts (magnesium
sulfate heptahydrate). The unfortunate drawback of using Epsom
salts is the accumulation of sulfate. How well do water changes
mitigate this?
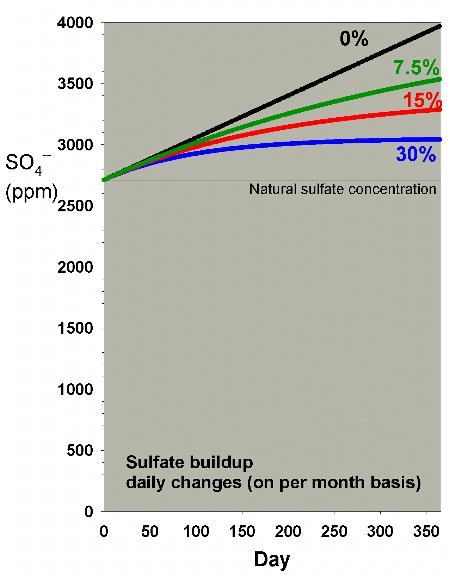
Figure 25 shows the rate of accumulation of sulfate that
I discussed in a previous
article in an aquarium with a medium usage of the system
(matching a demand of 8 ppm calcium and 0.4 meq/L of alkalinity
per day). It also shows the effect of daily water changes
amounting to 7.5%, 15% and 30% on a monthly basis. Clearly,
the 15% and 30% changes per month mitigate the rise in sulfate
over a year by a substantial amount (reducing the increase
by 54% and 74%, respectively).
|
Figure 25. Sulfate concentration as a function
of time when performing daily water changes equivalent
to 0% (no changes), 7.5%, 15% and 30% of the total volume
each month (in other words, 0%, 0.25%, 0.5% and 1% per
day). In this example, sulfate starts at a natural level
of 2710 ppm, and the model assumes usage of a moderate
amount of calcium chloride and sodium bicarbonate to
maintain calcium and alkalinity, and Epsom salts (magnesium
sulfate) to maintain magnesium.
|
 |
How to Perform Water Changes
There are many ways
to perform water changes, and some of these are outlined below.
Large batch water changes: These changes are what
most aquarists think of as water changes - remove some aquarium
water and replace it with new water. Reef aquarists often
talk of changing 10-30% per month this way. These changes
can be completely manual, using buckets and siphons. They
can also be partially or almost completely automated. Some
systems allow aquarists to open and close appropriate valves
(or turn on appropriate pumps), and pumps take care of the
actual removal and addition of water.
In doing batch changes, aquarists should consider the changes
in the water parameters that will result, and be sure they
do not excessively stress organisms. Differences in salinity
and temperature are most likely to be significant, and the
larger the change, the more stressful it can become for the
aquarium's inhabitants. If there is substantial ammonia in
the new water, as there may be in artificial
salt water or possibly in natural seawater that has been
stored for a while, that can also be stressful. Obviously,
any organisms that become exposed to the air can also be greatly
stressed. Differences in other water parameters are less likely,
in my opinion, to be particularly stressful during water changes,
with the possible exception of certain trace elements which
may be more toxic in raw artificial seawater when not bound
to organics
than after they have had a chance to become bound in the aquarium
or in natural seawater. The normally encountered differences
in calcium, magnesium, alkalinity, nitrate, phosphate,
silica, pH, etc., are unlikely to unduly stress organisms
during water changes up to 30-50% using natural seawater or
aerated artificial seawater, in my opinion.
Small batch water changes: These changes are similar
to the large changes above, but are much smaller and are
done more frequently. Daily changes of 0.25% to 2%, for
example, can be used. One could also do a series of consecutive
small water changes on the same day. This method ensures
that organisms near the top of the aquarium are not exposed
to the air, and that water parameter shifts are less sudden.
These types of changes can be done in a variety of ways,
such as by removing water via a skimmer and replacing it
once a day, or by simply taking out an amount (such as a
half gallon) and replacing it once a day (automatically
or manually). While lots of smaller changes (say, 30 changes
of 1% each) are slightly less efficient than one larger
one (30% in a single batch), the difference is small (30
changes of 1% each exactly matches one 26% batch water change),
and consequently other factors of convenience or stress
on organisms may be more important.
In doing batch water changes of 2% or less, aquarists need
not particularly worry about the changes in the water parameters
that will result, as long as the new water is of reasonable
quality. For example, a 1% change with new
water at 55°F from a basement reservoir will change the
aquarium temperature only from 81°F to 80.74°F. Differences
in salinity are also unlikely to be significant.
Continuous water changes: Continuous water changes,
despite their name, are not necessarily performed every
minute of every day. The distinguishing feature of these
changes is that water is added at the same time that it
is removed. The actual rate of addition can be high or low.
Reef aquarists (myself included) most often perform these
types of water changes with two matched pumps, one that
removes the old water and one that adds the new water. Often
these pumps are part of the same mechanism (such as two
sets of tubing on a peristaltic pump or two heads on a diaphragm
pump), but that is not a requirement. I use a dual head
diaphragm pump capable of a maximum of 30 gallons per day
for each head (a Reef Filler pump from Champion Lighting).
In my setup, once I have a 44-gallon trash can full of new
salt water, all I do to perform a 44 gallon or smaller water
change is plug in the pump. The wastewater is sent down
the drain. Sometimes I change 44 gallons in one shot, taking
about a day and a half. Sometimes I pump for a few hours
at a time, and then wait for a few days.
These changes are slightly less efficient than single batch
water changes of the same total volume. A continuous water
change of 30% exactly matches one batch 26% water change.
As with very small batch water changes, these have the advantage
of neither stressing the organisms (assuming the change is
done reasonably slowly), nor altering the water level in the
aquarium. The ease of doing such changes automatically also
makes it far more likely that busy or lazy aquarists will
actually do them.
Conclusion
Water changes are a good way to help
control certain processes that serve to drive reef aquarium
water away from its starting purity. Some things build up
in certain situations (organics,
certain
metals, sodium,
chloride,
nitrate,
phosphate,
sulfate,
etc.), and some things become depleted (calcium,
magnesium,
alkalinity,
strontium,
silica,
etc.). Water changes can serve to help correct these imbalances,
and in some cases may be the best way to deal with them. Water
changes of 15-30% per month (whether carried out once a month,
daily or continuously) have been shown in the graphs above
to be useful in moderating the drift of these different seawater
components from starting levels. For most reef aquaria, I
recommend such changes as good aquarium husbandry. In general,
the more the better, if carried out appropriately, and if
the new salt water is of appropriate quality.
Calcium and alkalinity, being rapidly depleted in most reef
aquaria, are not well controlled, or even significantly impacted
by such small water changes. In order to maintain them with
no other supplements, changes on the order of 30-50% PER DAY
would be required. Nevertheless, that option may still be
a good choice for very small aquaria, especially if the changes
are slow and automatic.
Happy Reefing!
|

