|
As discussed in
Part
I, we need to think of light in terms of photons. A photon
is the smallest discrete particle of energy that travels along
a wave defined by its wavelength, and the amount of energy
contained in the photon can be mathematically determined.
For the purposes of reefkeeping and human vision, we are interested
in photons that have a wavelength in the range 400-700nm.
In this article, we will look at how photons are generated
by light sources, determine how they are distributed according
to wavelength, how this distribution is represented as a spectral
plot, and the correct terminology used to characterize photons.
How are Photons Generated?
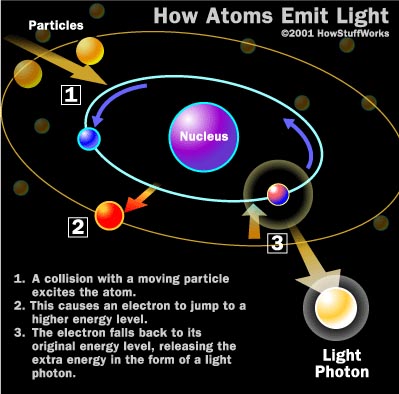
Any source of light is basically a
source of photons. Atoms emit light as a release of energy,
in the form of photons. Atoms under normal conditions are
in a ground state, with their electrons (the negatively
charged particles) moving around the atom's nucleus (which
has a net positive charge). An atom's electrons have different
levels of energy, depending on several factors, including
their speed and distance from the nucleus. Electrons with
different energy levels occupy different positions within
the atom. Electrons with greater energy move in an orbit farther
from the nucleus. When the atoms are excited (by the
addition of energy) the electrons jump to a higher energy
level. This is an unstable state, and the electron
quickly returns to a lower energy state by releasing this
energy as a photon. Because the jump from one energy level
to another is discrete, the photons carry a discrete amount
of energy. If this released photon has a wavelength that is
within the visible range of the electromagnetic spectrum it
appears as light. The light's wavelength depends on how much
energy was released which, in turn, depends on the electron's
position. Atoms of different materials have electrons at different
energy levels and hence release different 'colored' photons.
This is the basic mechanism for the generation of all light.
The following picture (Figure 1), taken from How
Stuff Works, helps explain the process.
|
Figure 1. How atoms emit light.
|
What differs in the various light sources is the mechanism
by which the electrons are excited and the composition of
materials used to provide the atoms. In an incandescent
lamp, atoms are excited by heat created by a
filament's electrical resistance. In a fluorescent
lamp free electrons are created between a cathode and anode,
and these free electrons are used to energize atoms of mercury,
which give off photons in the UV range. These UV photons
then strike the lamp's phosphor coating, pushing its
electrons to a higher energy level and emitting visible
light in different wavelengths, depending on the mix of
phosphors used. Metal halide lamps use a different approach,
in which atoms of metal halide gas are used along with mercury,
and are energized by a plasmal arc between electrodes.
What is important to note here is that a photon is a photon
is a photon… no matter what source is used to generate
it. In other words, a yellow photon from a candle's light
is the same as the yellow photon from the metal halide lamp.
The only difference is that the metal halide lamp generates
a lot more photons/second than the candle light.
Characterizing the Photons
A light source is basically a continuous
source of photons, in our case converting electrical energy
into visible photons. So when we characterize a light source,
we are interested in determining how many photons it generates
per unit of time. This is called its photon flux. These
photons are generated and spread in all directions, and ultimately
land on some object of interest (often in our case, the corals).
A light source generates photons at a constant rate, and as
we move away from the source, the photons will spread over
a larger area, hence fewer photons land on the target area
the further we move from the light source. We are interested
in how many photons land on a given area, usually 1 meter
square, and this number is called the photon density.
Additionally, we are interested in the photons that are available
for photosynthesis, which happen to be photons in the range
400-700nm (the same as visible light). These are called photosynthetic
photons. These three entities of interest combine to comprise
the Photosynthetic Photon Flux Density (PPFD), which
is a measure of the number of photons in the range of 400-700nm
falling on a 1 meter square area per second. PPFD is a measure
of Photosynthetically Available Radiation abbreviated
as PAR. Recall from Part 1 that to generate 1 watt
of power we would need 25.15 × 10¹⁷
photons/sec at 500nm. This is a lot of photons!!! Since we
are dealing with a large number of photons, the number of
photons are measured in units called micromoles (1 mole =
Avogadro's number = 6.022 × 10²³,
hence 1 micromole = 6.022 × 10¹⁷).
Hence the units of PPFD are micromoles/m2/sec,
so, a PPFD of 1 corresponds to 6.022 × 10¹⁷
photons falling on a 1 meter square per second. In the aquarium
hobby we often refer to light output in terms of PAR. Technically,
this is incorrect. PAR is typically measured as PPFD.
Different light sources have different distributions of photons
in the 400-700nm range. The light source can be characterized
by determining this distribution of the photons, and this
is done using an instrument called a spectroradiometer.
A spectroradiometer simply is an instrument that has a sensor
and associated hardware and software to determine the distribution
of energy (measured as power density in Watts/m2)
at different wavelengths of the electromagnetic spectrum.
This is usually displayed as a graph with the wavelength on
the X-axis and the power density on the Y-axis, and is called
the Spectral Power Distribution (SPD) plot.
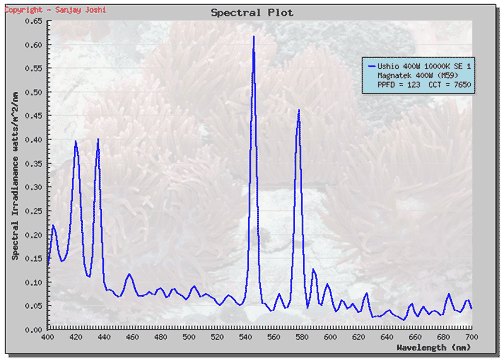
One such SPD plot is shown in Figure 2 below. This is the
most important piece of information about a light source,
and all relevant light measures can be derived from it.
|
Figure 2. Spectral Power Distribution for a 400-watt
Ushio lamp on a Magnetek (M59) ballast - 18" from
the lamp.
|
Note that for each wavelength the spectroradiometer measures
the power density in watts/m2.
This is termed the Spectral Irradiance. You may recall
from Part 1 that there is a direct relationship between power/energy
at each wavelength and the number of photons. For example,
as seen in the graph above, at 420nm the lamp produces 0.4
watts/m2 of power or 0.4
joules/m2/second of energy.
Using the relationship between energy and wavelength, it can
be determined how many photons/m2/sec
at 420nm will be required to generate 0.4 joules of energy
- 1.46 micromoles. Thus, we can easily convert from watts/m2
to micromoles/m2/sec. If
this is done for all wavelengths, we would get a plot that
shows the distribution of the number of photons at each wavelength
per meter squared per second.
|
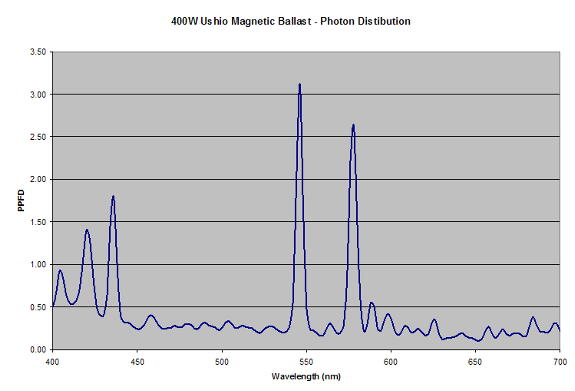
Figure 3. Photon Distribution (measured as PPFD)
for a 400-watt Ushio lamp on a Magnetek (M59) ballast
- 18" from the lamp.
|
Adding all the photons over the range of 400-700nm will provide
the measure of the photosynthetically available radiation
(PAR) measured in terms of PPFD. Technically, the photosynthetically
available radiation would be the area under the curve shown
in Figure 3. These computations are often performed by software
that is available with the spectroradiometers. Since the power
distribution and the photon distribution are mathematically
interchangeable, either of them can be used as the basis for
comparison of light output from different light sources.
On my website, www.reeflightinginfo.arvixe.com,
which catalogs the light output from various metal halide
lamps and ballast combinations, I have been using the spectral
power distribution to show the light output. By using the
data available, comparisons can easily be made between different
metal halide lamps based on their spectral distribution. The
plots depicted show the spectral irradiance at each wavelength.
The values indicate the amount of power density (Watts/m2)
at each wavelength. So, a lamp with higher power at a given
wavelength will also have a larger number of photons at that
wavelength.
What is important to note is the following:
1) Because each photon's energy is different at different
wavelengths, a different number of photons will be required
to produce the same amount of energy at different wavelengths.
To produce the same amount of total energy at 400nm would
require 57% less photons than at 700nm, because the photons
at 400nm have higher energy.
2) Because the PPFD is a summation of all photons in the
400-700nm range, two very different spectral distributions
can have the same PPFD. What this means is that there is
not a one-to-one relationship between PPFD and spectral
distribution, so knowing a light source's PPFD does not
tell us anything about how its photons are distributed.
Different light sources with similar PPFD values can have
very different spectral distributions. As seen in Figure
4 below, the two lamps have very similar PPFD values, but
their spectral distributions are very different. The independence
of PPFD and spectral distribution is one reason that we
must consider spectral distribution data as well as PPFD
when comparing light sources.
 |
|
Figure 4. Comparison of the spectral distribution
of two lamps with similar PPFD values.
|
3) Also note that PPFD measures photons falling on a given
area; the number of photons falling on this area changes
as its distance from the light source increases. Hence,
when comparing lamps' PPFDs it is very important to know
the distance at which the measurements were taken, and only
PPFD values at the same distance can be compared.
The spectral distribution of the lamps is quite different
when compared to sunlight. Figure 4 also shows the spectral
plot of sunlight at the surface of the water in the tropics
at noon time during summer. For a more detailed comparison
of the underwater light field to natural light underwater,
the reader is referred to "Underwater
Light Field and its Comparison to Metal Halide Lighting."
Inverse Square Law of Light
The relationship
between PPFD and distance from the light source follows what
is called the Inverse Square Law, as long as the source is
a point source of light.
According to the Inverse Square Law:
PPFD1/PPFD2
= (D2/D1)2
D1 and
D2 = distance at which PPFD1
and PPFD2 are measured.
This rule basically says that if you know
the PPFD at a given distance from the lamp, then you can compute
the PPFD at any other distance. It will vary as an inverse
function of the square of the distance.
For example, if the PPFD is 100 at 1 meter, then at 2 meters
it is 25. If the distance is doubled, the irradiance is reduced
to ¼ of the value at the original distance. This effect
can be easily visualized by shining a flashlight on the wall.
Stepping away from the wall increases the size of the light
spot and decreases its intensity.
This rule is applicable only to point sources of light (or
lights whose source can be approximated by a point). The "five
times rule" is often used as the rule of thumb. As long
as the distance from the source is five times the size of
the emitting source, we can consider it to be a point source
of light. For a clear metal halide lamp, the size of the point
source can be considered to be the inside envelope that contains
the gases. If we wanted to consider a 4' fluorescent lamp
to be a point source, it would have to be at least 20' away!
Similarly, a 2' reflector would have to be at least 10' away
to be approximated as a point source.
Summary:
In this article,
I have described how the light from a source can be characterized
by the distribution of the photons that emanate from it. Two
mathematically equivalent plots - one using the power density
distribution at each wavelength and the other using numbers
of photons - can be used to show the distribution as a spectral
plot. The light available for photosynthesis is termed PAR,
and is typically measured as PPFD (photosynthetic photon flux
density) with units of micromoles/m2/sec.
Using just the PPFD number gives us information only about
the number of photons in the 400-700nm range but does not
tell us anything about their spectral distribution. Two lamps
with the same PPFD can have very different spectral distributions.
Additionally, the PPFD measurements can be compared only if
the distances at which the measurements are taken are the
same. However, given that light follows the Inverse Square
Law, we can compute PPFD at different distances if we know
it at one particular distance.
The next article in the series will discuss other measurements
of light that you may have seen such as Lux and Lumens and
how they relate to measurements of light for photosynthesis.
|