|
One the most abused
and misunderstood terms in reef aquarium lighting is color
temperature. Lamps, both fluorescent and metal halide, are
being sold in the hobby based on color temperature ratings
ranging from 5000K to 50000K, with a wide range of values
in between. It is not uncommon to find lamps rated as 6500K,
10000K, 11000K, 12000K, 12500K, 13000K, 14000K, 15000K, 18000K,
20000K and 50000K being sold in the hobby. As interpreted
by reef aquarists, these numbers tend to convey the apparent
"blueness" of the light emitted by the lamps. The
aquarium lighting industry has used this color temperature
interpretation as a way to label their lamps, and use it to
signify how their lamps would appear in comparison to other
lamps and as a selling point for their lamps. It has been
my experience, however, that these numbers often seem to be
rather arbitrarily created and often there is very little
correlation between the scientifically defined term of color
temperature and the label on the lamp, thereby making it more
difficult for the aquarist to make choices based on color
temperature ratings. In this article I will explain the concept
of color temperature, its relationship to spectral power distribution,
and the color temperature nuances of light sources.
Understanding color temperature starts
with understanding black body radiation and the Kelvin temperature
scale. A theoretical black body is an object that has no color
and is "black" because it absorbs all radiation
incident on its surface and emits no radiation at 0° Kelvin.
In the Kelvin temperature scale, 0° Kelvin (abbreviated
by K) corresponds to -273.16° C and is the temperature
where all molecular motion has ceased. This is called absolute
zero. Recall that for radiation to be generated, the electrons
have to be jumping to higher energy levels and releasing the
energy as photons. At absolute zero all motion ceases and
there is no energy being emitted. Hence, at 0K the black body
emits no radiation.
As the black body is heated above 0°K it starts to emit
radiation that lies within the electromagnetic spectrum. The
radiation's spectral distribution depends on the black body's
temperature. At low temperatures (e.g. room temperature) the
black body is emitting radiation, but it is not in the range
that is part of the visible spectrum. For visible radiation
the back body must be quite hot. At about 1000K it looks red,
yellow at about 1500K, white at 5500K, bluish-white at 6500K
and more bluish at 10000K. The spectral irradiance of the
radiation and color changes with temperatures have been well
studied by physicists, and the relationships are given by
the well-known black body radiation laws. Plank's law gives
the spectral irradiance at different wavelengths, Wien's
law provides the wavelength at which the peak irradiance
occurs, and Stephan
Boltzman's law relates the total amount of energy to the
temperature of the black body. Details of these can be found
in any physics textbook and will not be covered here.
Figures 1-3 below show the radiation of the black body at
different temperatures and the peak of the radiation. It also
shows the visible portion of the radiation as colored bands.
This is how a perfect black body radiator behaves, and the
radiation is a function of the temperature to which it is
heated.
How does this relate to the light sources we use - fluorescent
and metal halide lamps? Does this mean that a lamp being sold
as a color temperature of 20000K is a black body radiator
and has an actual physical temperature of 20000K? No, since
the lamps are not black body radiators! To be able to assign
a color temperature to a light source there must be a color
match as well as a spectral match to a black body radiator.
The spectral output of fluorescent lamps and metal halide
lamps does not match with the black body spectral irradiance.
Hence, the term color temperature, in fact, does not apply
directly to these light sources. What it really means is that
if we were to compare the lamp's color to a black body at
20000K, it would appear the same to a human observer. The
technically correct term for this is Correlated Color Temperature
(CCT) which is defined as the value of the temperature
of the black body radiator when the radiator color matches
that of the light source. CCT implies a color match to a black
body at the specified temperature, but there is no spectral
match. The table below shows CCT of various light sources:
| 1500
K |
Candlelight |
| 2680
K |
40-watt
incandescent lamp |
| 3200
K |
Sunrise/sunset |
| 3400
K |
One
hour from dusk/dawn |
| 5000-4500
K |
Xenon
lamp/light arc |
| 5500
K |
Sunny
daylight around noon |
| 5500-5600
K |
Electronic
photo flash |
| 6500-7500
K |
Overcast
sky |
| 9000-12000
K |
Blue
sky |
This now brings up the issues of matching lamp color to color
temperatures of the black body. Once we start talking about
color, we have to remember that color is not a physical property
but a physiological response created in the brain by the visible
light seen by the eye. As someone adequately surmised, "Color
is only a pigment of your imagination."
To be able to work with color mathematically, scientists
have developed a mathematical means to specify color - where
color is specified by numerical values called color coordinates
or chromaticity. Correlated Color Temperature (CCT) can be
determined by mathematical formula to find the chromaticity
coordinates of the black body's color temperatures that are
closest to the light source's chromaticity. (More on chromaticity
and how it developed later.)
Since it is a single number, CCT is simpler to communicate
than chromaticity or SPD, and is used as a shorthand for reporting
the color appearance of light emitted from electric light
sources. Correlated Color Temperature values are being used
by the reef lighting industry to give a general indication
of the apparent "blueness" of the light emitted
by the source. According to aquarium lighting industry convention,
lamps with higher CCT values provide light that appears "more
blue."
To develop a mathematical and more unambiguous definition
of color and color perception, the International Lighting
Commission (Commission Internationale de l'Eclariage, referred
to as CIE) established a colorimetry system for color matching
that has, with minor changes, remained in use for the last
75 years. To understand the proper definition and meaning
of CCT we need to understand color vision, how the chromaticity
diagram was established, and how it is used to determine CCT
of light sources.
Color Vision
Before understanding
the CIE color diagram, it is important to understand how the
human eye sees color. The human eye contains two different
kinds of receptors - rods and cones. The rods are more sensitive
and outnumber the cones, but the rods are not sensitive to
color. Color vision is provided by the cones. There are basically
three types of color sensitive cones in the human eye, corresponding
roughly to red, green and blue. The response curves of these
different cones have been mapped by researchers. The perception
of color depends on the neural response of the three types
of cones. Hence, it follows that visible color can be mapped
in terms of the response functions of these three types of
cones. It was shown that color samples could be matched by
combinations of monochromatic colors: red (700 nm), green
(546.1 nm) and blue (435.8 nm). These matching functions were
determined by experiments. By simply adding various amounts
of these primary colors a large range of colors could be matched,
but there were still some outside this range that could not
be matched by pure addition. It was found, however, that by
allowing negative values of red, all colors could be matched.
Allowing negative values of red is the same as adding red
to the color sample being matched.
CIE Chromaticity Diagram
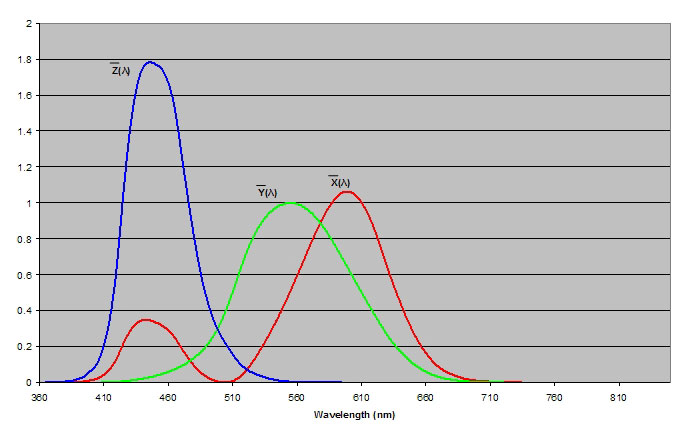
The CIE matching functions were derived
from these Red, Green and Blue matching functions such that
the matching functions are all positive, and any color can
be considered to be a mixture of the three CIE primaries.
These "primary colors" can be represented as mathematical
functions of their wavelength, and are shown in Figure 4 below.
The most commonly used CIE primaries were developed in 1931
using a two-degree field of view; since then, others have
been defined using a 10-degree field of view and the functions
were updated in 1964.
|
Figure 4: 1931 CIE Color Matching
Functions.
|
The CIE color coordinates are derived by weighting the spectral
power distribution (obtained by using a spectroradiometer)
by these three functions. This gives three values, called
the tristimulus values (X, Y, Z), from which the chromaticity
coordinates are calculated. Without going into the mathematics
of computing these values (we can let a program compute them),
the Y value is a measure of luminosity, or how bright
the light appears to an observer. These Y values are, in fact,
defined to be the same as the photopic response of the human
eye. Because perceived color depends on the relative magnitudes
of X, Y and Z, the chromaticity coordinates are usually given
by normalized coordinates x and y, where x = X/(X+Y+Z), y
= Y/(X+Y+Z) and x+y+z = 1. The (x, y) coordinates are called
the chromaticity coordinates. In the computation of
the chromaticity coordinates the Y value is normalized to
100.
The figure below shows the 1931 CIE chromaticity diagram.
The color temperature of a true black body is also shown on
this chart. The path taken by the black body color temperature
is called the black body locus. The pure spectrum colors appear
on the outside along the curve, and points representing non-spectral
colors are inside. A straight line connects the ends and represents
colors that are combinations of wavelengths of 400 nm and
700 nm (blue and red).
Mathematically, the Correlated Color Temperature of a light
source is computed by determining the (x,y) color coordinates
of the light source, and by finding the color temperature
closest to the lamp (x,y) that lies on this black body locus.
Details of this approach are beyond the scope of this article,
but interested readers are referred to Reference 1.
What is important to note is that using such an approach,
two points on either side of the black body locus can have
the same CCT but different color coordinates. To prevent this
from creating large differences in the perceived color of
light represented by the same color temperature, a small tolerance
zone is typically specified near the black body locus, and
if the two points are outside this tolerance, then larger
color differences will be perceived.
One drawback of the 1931 chromaticity diagram is the fact
that equal distances on the chart do not represent equally
perceived color differences because of the non linear nature
of the human eye. The 1976 uniform chromaticity CIE chart
(Figure 6) was developed to provide a perceptually more uniform
color spacing for colors at approximately the same luminance.
The coordinates used here are denoted (u',v') and can be computed
from the 1931 x,y coordinates by the following transformation:
u'= 4x / (-2x + 12y + 3)
v'= 9y / (-2x + 12y + 3)
This excellent website
provides the mathematical equations and a calculator to convert
between the various color coordinates developed. In spite
of its drawbacks, the 1931 color chart is still one of the
most popular in use.
|
Figure 6: The 1976 CIE chromaticity
diagram.
|
Another artifact of using the CCT arises from the fact that
a single number is once again being used to characterize the
SPD
of the lamp. It is very possible that two very different spectral
power density functions can have the same CCT, as shown in
the Figure 7 below taken from http://www.lrc.rpi.edu/.../lightsources/measure.asp.
Light sources with different spectral distributions but with
the same CCT are called metameric light sources.
|
Spectral
power distribution of two metameric light sources:
|
 |
 |
|
|
Figure 7: The SPD on the left
is that of an incandescent lamp with a CCT of 2856 K.
The SPD on the right is of a red, green and blue LED
mixed spectrum that is metameric with the incandescent
lamp.
|
While it is too complex to represent the color appearance
of a light source precisely by the color coordinates, it does
provide a useful approximate representation of the appearance
of the light source. The color theory can mathematically represent
color and provide a mathematical specification of color, yet
there is still a difference between color specification and
humans' color experience. For example, brown and orange can
have the same color coordinates on a CIE chart, but both produce
a very different color experience in the human eyes. This
artifact of color appearance is very difficult to represent
in the CIE color chart and its mathematical representation
of color. This situation arises due to the normalization of
the luminosity function.
Color Coordinates of Metal Halide Lamps
As seen from the above discussion,
the main input required to calculate the CIE chromaticity
coordinates is the spectral distribution and the functions
for the CIE primary colors. The spectral data is obtained
using the Licor 1800 Spectroradiometer. Software for the spectroradiometer
has built-in functions to compute the 1931 CIE color coordinates.
Using this, the color coordinates of a sampling of "blue"
250-watt mogul metal halide lamps sold as 13000K, 14000K and
20000K are computed and shown in the table below.
|
Color
coordinates of some common "blue" 250-watt
mogul metal halide lamps on different ballasts:
|
| Lamp |
Ballast |
Lamp
Wattage
|
x
|
y
|
| Hamilton
14KK |
Icecap |
250
|
0.22089
|
0.18143
|
| Hamilton
14KK |
M58 |
250
|
0.21012
|
0.15708
|
| Hamilton
14KK |
M80 |
250
|
0.23958
|
0.21082
|
| PFO
13KK |
Icecap |
250
|
0.2711
|
0.24933
|
| PFO
13KK |
M58 |
250
|
0.25726
|
0.24004
|
| PFO
13KK |
M80 |
250
|
0.2601
|
0.25546
|
| Aquacon
14KK |
Icecap |
250
|
0.26161
|
0.22229
|
| Aquacon
14KK |
M58 |
250
|
0.23984
|
0.19343
|
| Aquacon
14KK |
M80 |
250
|
0.28639
|
0.26015
|
| Aquacon
14KK |
ReefFan |
250
|
0.27209
|
0.23451
|
| Radium
- 20KK |
Icecap |
250
|
0.19626
|
0.14491
|
| Radium
- 20KK |
M80 |
250
|
0.20159
|
0.15539
|
| XM
20KK |
Icecap |
250
|
0.19235
|
0.12632
|
| XM
20KK |
M58 |
250
|
0.198
|
0.13989
|
| XM
20KK |
M80 |
250
|
0.20299
|
0.14727
|
|
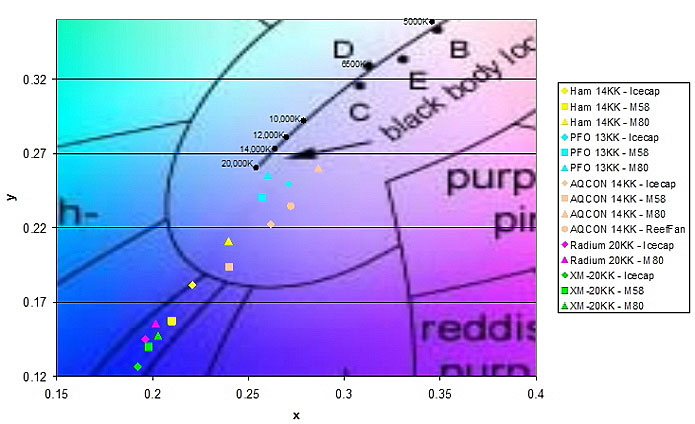
These chromaticity coordinates are plotted on the CIE diagram,
as shown in Figure 8 below. The background color for the plot
is obtained by superimposing the color diagram from Figure
1. The plot is scaled to show only the relevant piece of the
chart.
|
CIE (1931 2deg) Chromaticity Coordinates
of 250-watt Mogul "Blue" Lamps:
|
 |
|
Figure 8: Color coordinates
of some "blue" 250-watt mogul metal halide
lamps.
|
Summary
This article presented an overview
of how color temperature is correctly defined and what it
means. For lamps used in the aquarium hobby - both fluorescent
and metal halide - the correct term to describe the color
temperature is the Correlated Color Temperature (CCT). Correlated
color temperature is derived from the chromaticity coordinates
of the lamp, which, in turn, are determined by the spectral
power distribution and the CIE color matching functions. Based
on the mathematically accepted definitions, we should expect
the CCT of metal halide lamps sold in the hobby to be close
to black body locus, in the vicinity of their specified color
temperature. Unfortunately, this is not the case with most
metal halide lamps, especially the ones that have significantly
"blue" appearance.
|


 "Click here for larger image")


 "Click here for larger image")
)
