|
Introduction:
I have been in this
hobby for almost five years and my tank's lighting has always
been a mystery to me. I have read several excellent articles
on lighting (see additional reading list at the end of this
article), but most of them didn't seem to apply to my specific
lighting situation. I have observed many online questions
about lighting, and the answers are always incredibly varied
because the people who respond typically base their response
on their own systems or, worse - from their gut, guessing
or repeating what they have read or been told.
Well, for those of you who didn't read
my Cirolanid
Isopod article, you should know that I don't like gut
feelings or guessing when I can get hard data. I soon found
Eric Borneman's Lighting
Banter and the Problem with Thumb Rules and read Mike
Paletta's article
that introduced me to the term lux meter. I thought about
obtaining one for this voyage of discovery, but lux just sounded
too much like lox to me, and that brought back some bad memories.
|
|
|
Photo 1: My Apogee™ quantum meter.
|
Then I came across Mike
Kirda's article that presented some actual data obtained
using an Apogee™ quantum meter (see Photo 1). As soon
as I heard the term quantum meter, I knew I just had to have
one, because "quantum" reminds me of Star Trek,
Quantum Leap, quantum mechanics, etc. Mr. Kirda's article
does a good job of describing the quantum meter and its limitations;
namely, that the Apogee™ meter does not accurately detect
the blue spectrum of light, so the PAR values for my VHO lights
are most likely underreported by approximately 50%. The Apogee™
meter can measure the PAR of both sunlight and electric lamps,
but in both cases the units of measurement are µmol/m-2/s-1.
More information on µmol/m-2/s-1
can be found in Kirda's article or in Dr. Joshi's Facts
of Light Part II: Photons.
In this article I will focus the results
of my findings on some questions I've always wanted to answer
with data. If you have been around the hobby for a while I'm
sure you've heard many of these questions. How often should
I change my metal halide light bulbs? How big is the difference
in output between old and new bulbs? Will a better skimmer
really help more light reach my corals? This article is the
first in a two-part series in which I attempt to answer some
of these questions. Part I will focus more on short-term questions,
and Part II will focus on answering long-term questions and
some questions raised by the data in Part I.
My Setup
I have a 75-gallon
main tank (48.5"L x 18.5"W x 21"H; 123.2cm
L x 47cm W x 53cm H) with a 29-gallon tank (30" L x 12"W
x 18"H; 76cm L x 30cm W x 45cm H) as a sump. While the
sand bed's depth varies, it is typically 16-17" (40-43cm)
from the water's surface to the top of the sand bed.
My main tank's lighting (see Photo 2) consists of two fixtures:
-
Two 175-watt XM 10,000K single-ended metal halide bulbs
powered by two Hamilton magnetic (M57) ballasts. Bulb
position and orientation: parallel to front glass and
7.5" above the water's surface.
-
Two 110-watt URI Super Actinic VHO fluorescent lamps
in a 46.5" (118.1cm) fixture powered by an Icecap
660 electronic ballast. Bulb position and orientation:
parallel to front glass and 8" (20cm) above the water's
surface.
|
Photo 2: Reflector and bulb arrangement in my
tank.
|
|
|
|
Photo 3: Commercial Electric's
6500K bulb.
|
Main Tank Lights:
Two 175-watt XM 10,000K bulbs used for 13 months for 6.5 hours
a day, on average.
Two 110-watt URI Super Actinic fluorescent lamps with built-in
reflectors used for 13 months for 10 hours per day, on average.
Sump Lighting:
I currently use Commercial Electric's 6500K - 19-watt bulb
(Photo 3), typically available at Home Depot.
Methodology and Sensor Holder
As soon as I received my Apogee™
quantum meter, I started taking readings in my tank. I quickly
realized that holding the sensor in the tank with my arm would
never result in consistent readings. A vertical movement of
only 1-2" (2.5-5cm) produced a difference of over 50
µmol/m-2/s-1
in the readings, and a horizontal tilt of 15 or 20 degrees
also resulted in a large difference.
|
|
|
Photo 4: Custom sensor holder.
|
I thought about this problem and collaborated with Nick from
Nick's
Acrylic Reef to build a sensor holder that I thought would
keep the readings consistent (see Photo 4). This would allow
me to mount the sensor on a piece of acrylic that would keep
the sensor level and minimize the time my arms were in the
tank. This was done to prevent oil and shadows from my arm
from impacting the sensor readings. I also used a Sharpie™
to mark positions on the holder and the canopy's frame so
I could return the sensor to exactly the same location in
the tank each time. With this holder, I can confidently state
that I was able to consistently measure each position in the
tank within 0.5" (1.3cm) horizontally and vertically.
My tank sits within a few inches of a window that receives
strong daylight in the early evening, so I ran all tests after
it was dark outside and my quantum meter showed 0 µmol/m-2/s-1
when placed on the middle of the windowsill shielded from
the light from the tank. All tests were run with the bulbs
having been on for at least 60 minutes and having been cleaned
with Windex the morning of the tests, unless noted otherwise.
This was done to eliminate the variability in PAR caused by
salt creep on the bulbs. I feed my tank two to four times
a week and to maintain consistency in measurements, I always
measured the evening following a day of feeding, typically
around 36 hours after feeding.
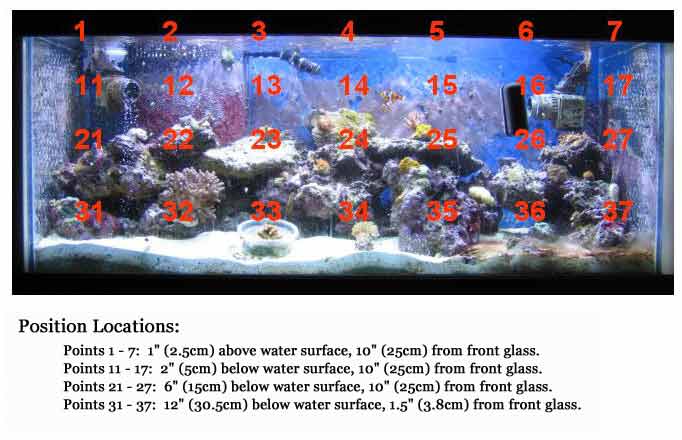
I carefully planned the locations inside and outside of the
tank where I would take measurements. Photo 5 shows all the
points inside the tank where measurements were taken, and
these points are referred to in the results below. I also
took measurements outside of the tank to see the effects of
light exiting out of the tank. All measurements, however,
were 0-3 µmol/m-2/s-1,
so I chose not to include any locations outside the tank in
this article.
|
Photo 5: Data collection points.
|
I then spent some time collecting data trying to answer
my questions. I immediately noticed fluctuations, however,
while taking a single reading at the same position, of 30
PAR, which would have made drawing any kind of conclusions
from the data difficult. I decided to reinforce the sensor
holder by putting two screws on the tank mount bracket and
the horizontal mount bracket. This reduced the variability
in the readings, but there was still too much fluctuation.
I then realized that my Rio SEIO™ powerheads were causing
a lot of disturbance on the water's surface. With the SEIO™
powerheads shut off while taking readings, the fluctuations
dropped to 0-4 PAR depending on which position I was measuring,
which was good enough to get some relatively consistent readings.
I observed that fluctuations dropped to zero if the return
pump was turned off, but that lowered the water level, thereby
changing the PAR readings more than the small fluctuation
caused by the return pump. Because I wanted to know what light
intensity the corals were receiving, I decided to leave the
return pump running instead of lowering the water level.
In the next section of this article I will ask some questions
and answer them with the data collected in my tank. Please
keep in mind that these answers are specific to my particular
lighting setup and methodology. Just because the data indicate
a particular answer in my tank, they might indicate something
very different in your tank. If you choose to use a sensor
holder in your tank, I would be very interested in talking
about your results. Some of the answers will help people maximize
the utilization of their current lighting, regardless of their
light setup.
The Results by Question and Answer
Tests 1 and 2 - Question: Does cleaning the bulbs
and center brace really help increase light intensity in the
tank?
Test Setup:
Tests 1 and 2: I deliberately let salt spray accumulate on
my main tank lights and center brace for two months with no
cleaning. Salt spray on the bulbs was minimal as they are
7.5" (19.1cm) and 8" (20cm) above the surface. I
first took a set of readings with a salt-crusted center brace
and salt-crusted metal halide bulbs after they had been running
for one hour. The VHO bulbs were left off for these tests.
Test 1: I shut off the metal halide bulbs and allowed
them to cool, cleaned them and turned them back on and let
them run for one hour before taking readings again. Note:
Both metal halide bulbs were on during these tests, so it
is possible that cleaning one of the bulbs could have affected
the readings underneath the other bulb. However, this test
was done to see the overall effect of cleaning both bulbs
at the same time.
Test 2: I then left the metal halide bulbs on and
cleaned the center brace. I then took readings underneath
the brace to see the difference between the dirty and clean
bulbs and center brace.
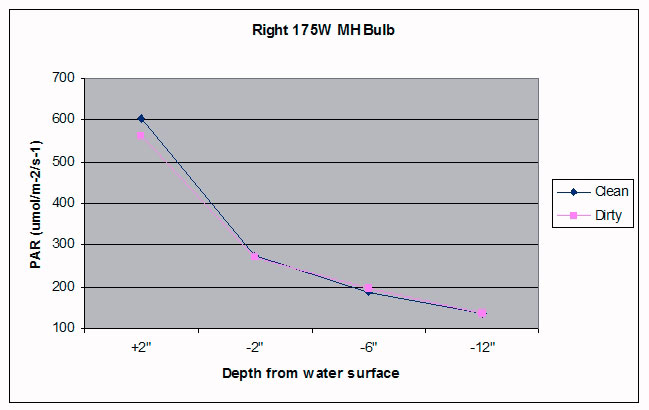
Answer for Tests 1 and 2: Cleaning definitely did
help. The positions on the left side of the tank had a greater
increase in intensity than the positions on the right side
of the tank. I assume the difference is because the left metal
bulb had a greater accumulation of salt spray than the right
metal halide bulb. The left metal halide bulb obviously had
more salt spray on its glass shield than the right one did
and cleaning had a much larger impact on the values recorded
(see Graphs 1 and 2). At 6" (15cm) of depth the PAR reading
was 12% higher than the right bulb. But what was even more
dramatic was the effect of cleaning the center brace (see
Table 1).
|
Graph 1: Test 1 - Sensor readings for positions
3, 13, 23, 33 before and after cleaning both bulbs.
|
|
Graph 2: Test 1 - Sensor readings for positions
5, 15, 25, 35 before and after cleaning both bulbs.
|
|
Position
|
Dirty
Bulbs and Brace Reading
|
Clean
Bulbs and Brace Reading
|
Percent
Increase
|
|
4
(above brace)
|
381
|
383
|
<
1%
|
|
14
(2 underneath brace)
|
180
|
243
|
35.00%
|
|
34
(12 underneath brace)
|
153
|
170
|
11.10%
|
|
Table 1: Test 2 - The effects of cleaning the
metal halide bulbs and the center brace on PAR readings
underneath the brace.
|
Test 3: I have often wondered what effect salt creep
and lamp position would have on my sump's light intensity.
I typically positioned my Commercial Electric sump bulb about
5-7" (13-18cm) above the water surface and at an angle
because it allowed me to work easily in the sump area.
Answer for Test 3:
To illustrate clearly how the bulb was usually positioned,
I set it up on my quarantine tank (see Photo 6).
|
Photo 6: The sump bulb's typical position.
|
I had not cleaned my sump bulb in at least three months,
so it was approximately 40% covered with salt creep, and some
of the reflector's surface was covered in salt creep as well.
I took PAR readings ¾" (2cm) away from the bulb,
at the water's surface (7" (18cm) away) and 2" (5cm)
and 4" (10cm) underneath the water's surface. I then
moved the bulb to just 3" (8cm) above the water's surface
and directly over the sensor (see Photo 7) and took PAR readings
again.
|
Photo 7: Directly overhead sump bulb position.
|
I then cleaned the old bulb and reflector with a vinegar
and freshwater soak and took PAR readings in both positions
again. I then took the same socket and reflector, put in a
brand new bulb and let it run for one hour before taking PAR
readings in both positions. The readings were very interesting,
and I've listed them in Table 2.
|
Bulb Age: |
6
months
|
6
months
|
6
months
|
6
months
|
1
hour
|
1
hour
|
|
Position: |
Angled
|
Angled
|
Direct
|
Direct
|
Angled
|
Direct
|
|
Salt Creep: |
Yes
|
No
|
Yes
|
No
|
No
|
No
|
|
Depth:
|
|
|
|
|
|
|
|
¾"
(1.5cm) from bulb |
830
|
1118
|
830
|
1120
|
1620
|
1620
|
|
Water surface |
66
|
98
|
350
|
530
|
117
|
580
|
|
2"
(5cm) below surface |
36
|
59
|
170
|
270
|
68
|
309
|
|
4"
(10cm) below surface |
29
|
45
|
93
|
130
|
49
|
148
|
|
Table 2: (Test 3) Effects of Bulb Position, Age
and Salt Creep on PAR Readings.
|
With the six-month-old light bulb, cleaning the bulb and
reflector increased PAR readings by 26-39%. While this is
a good gain, by repositioning the bulb directly over the sensor
and closer to the water, a gain of 189-441% in PAR readings
was recorded. By replacing the old bulb and positioning the
new bulb directly overhead, the PAR readings jumped by 410-779%.
This table shows that hobbyists should consider placing their
sump bulbs optimally to increase their existing lights' efficiency.
Since I changed the sump bulb's position, the Chaetomorpha
algae's growth rate has been considerably faster. For safety
reasons, however, hobbyists should be sure to leave enough
room for their bulbs to stay above water in the case of a
power outage and a resulting increase in the sump's water
level. In addition, a safety chain or zip ties should be used
to prevent the light fixture from accidentally falling into
the water.
These data suggest that by simply positioning your bulbs
properly, and cleaning them and any braces frequently, the
amount of light your animals are receiving can be increased
for the meager sum of the cost of a paper towel, a smidge
of cleaning solution, and your time.
Test 4 - Question: Does MH bulb orientation change the
light intensity reaching my corals?
Test Setup: The first set of data was with the point
source inside the MH bulb oriented vertically with the "nipple"
pointing upwards as shown in Photo 8. Data were collected,
and then the MH bulbs were turned off and allowed to cool.
After the bulbs had cooled they were oriented so the point
source inside them was oriented horizontally as shown in Photo
9. The bulbs were turned back on and allowed to run for 60
minutes before intensity measurements were taken again.
|
Photo 8: A single-ended bulb in a vertical point
source orientation.
|
|
Photo 9: A single-ended bulb in a horizontal
point source orientation.
|
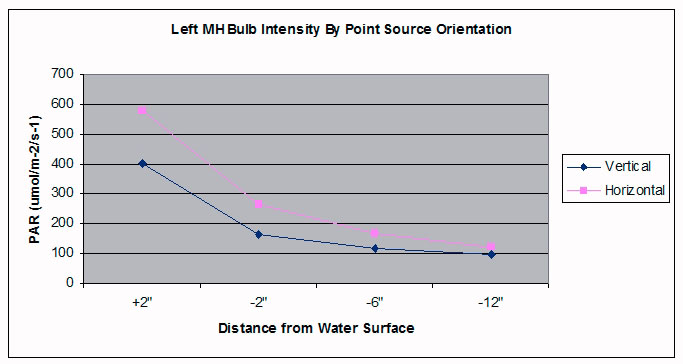
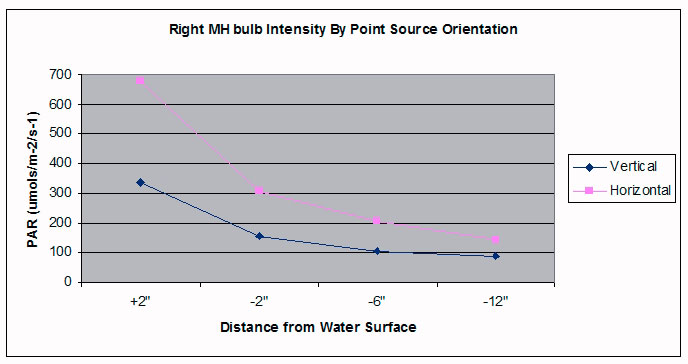
Answer: Possibly. Some MH bulbs are designed to produce
even light distribution on all sides, but when I ran my tests
on the XM 175-watt single-ended bulbs there was a dramatic
difference. It should be noted that double-ended MH bulbs
are designed to fit in fixtures with one orientation, so this
test addresses only single-ended bulbs.
Vertical orientation dramatically decreased light intensity
of light in all areas of the tank compared to horizontal orientation.
Light intensity in the water dropped from 8.51% to 51.27%,
depending upon the sensor's position in the tank. The most
dramatic difference was immediately underneath the MH bulbs
as shown in Graphs 3 and 4. Positions 35, 36 and 37 under
the right MH bulb had an average of 40% more PAR at 12"
under the water's surface. The orientation of the point source
might have little effect in other bulbs; it could be another
design factor (see Harker 2002a and 2002b).
|
Graph 3: PAR readings directly under the MH bulbs
(positions 3, 13, 23, 33).
|
|
Graph 4: PAR readings directly under MH bulbs
(positions 5, 15, 25, 35).
|
Test 5 - Question: My tank has been running hot; can I
open the hood to reduce heat without losing too much intensity?
Test Setup: I took four PAR readings at each position
in the tank without moving the sensor holder. This was done
to eliminate any variability caused by sensor placement. Two
readings were taken with the hood open and two with the hood
closed.
Answer: Opening the hood will help disperse heat in
extreme situations but it is only a temporary solution. My
canopy is enclosed on both sides and has only a 3" gap
in the back with the front able to be flipped open (see Photos
10 and 11). I have always wondered how much light I was losing
when I opened the hood because the room gets significantly
brighter.
|
Photo 10: Canopy closed.
|
Photo 11: Canopy open.
|
The PAR values did drop with the hood open, but only an average
of 4% throughout the tank compared to when the hood was closed.
Testing outside the tank with the hood open and closed showed
an insignificant amount of PAR lost to the room at the same
level as the sandbed inside the tank (0-3 µmol/m-2/s-1).
I am curious how much light is lost in aquaria that have only
an open top with a hanging pendant.
Test 6 - Question: I have heard that using "egg crate"
will focus the light so that more will enter my tank and less
will bleed out of the tank into the room. Is this true?
Test Setup: After reading a thread
by Anthony Calfo (2006), I became curious as to the effect
egg crate would have on PAR readings in my tank. On the day
of this test I first conducted tests with no egg crate over
the tank. I then placed newly cleaned egg crate over the tank
(tapered side up) and retook the readings. In order to move
the sensor holder without disturbing the egg crate, the first
1" (2.5cm) at the front of the tank was not covered in
egg crate. I recorded PAR readings for no egg crate, egg crate
3" (8cm) from the MH bulbs and 6" (15cm) from the
MH bulbs. Positions 1-7 were not recorded due to interference
with the egg crate. The florescent bulbs were turned off for
this test.
Answer: Directly under the MH bulbs there was little
change in intensity. However, the positions not directly underneath
the MH bulbs saw significant decreases in light intensity
when egg crate was used, up to 52% (see Tables 3 and 4). Overall,
the egg crate 3" (8cm) away from the bulbs lead to a
smaller decrease than when the egg crate was 6" (15cm)
away from the bulbs, but it was still a significant decrease
in almost all positions measured. Outside the tank I saw a
slight drop in PAR 18" (46cm) from the tank (2 µmol/m-2/s-1
vs. 3 µmol/m-2/s-1
without the egg crate).
|
Depth
|
1
|
2
|
3
|
4
|
5
|
6
|
7
|
|
-2
|
-43%
|
-35%
|
0%
|
-52%
|
-9%
|
-39%
|
-40%
|
|
-6
|
-45%
|
X
|
-1%
|
-19%
|
0%
|
-24%
|
X
|
|
-12
|
-48%
|
-34%
|
-33%
|
-27%
|
-25%
|
-34%
|
-49%
|
|
Table 3: Percent change in PAR readings from
no egg crate to egg crate 6" (15cm) away from MH
bulbs.
|
|
Depth
|
1
|
2
|
3
|
4
|
5
|
6
|
7
|
|
-2
|
-51%
|
-26%
|
-3%
|
-21%
|
4%
|
-29%
|
-41%
|
|
-6
|
-43%
|
X
|
-1%
|
-19%
|
-2%
|
-25%
|
X
|
|
-12
|
-43%
|
-36%
|
-23%
|
-16%
|
-18%
|
-30%
|
-38%
|
|
Table 4: Percent change in PAR readings from
no egg crate to egg crate 3" (8cm) away from MH
bulbs.
|
While I did not report the results here, I also tested the
effect of the egg crate on just my florescent bulbs. It was
a much less dramatic decrease, but still a decrease. I believe
this is because my bulbs are 8" (20cm) from the water
surface, and a significant amount of their intensity is already
lost by the time the light reaches the egg crate. Perhaps
if my florescent bulbs were properly positioned (2-3"
(5-8cm) above the water surface), then I would have seen an
increase as reported by Anthony Calfo. These results demonstrate
the importance of bulb distance from the water surface, distance
between the bulbs and the egg crate and actually testing changes
in your tank instead of just adopting a new way of doing things.
Test 7 - Question: I have been using a lousy skimmer for
awhile now; if I start using a much better skimmer, will the
increased skimming lead to more light intensity for my corals?
Test Setup: I had been running my system with a TF100A
(Top Fathom) skimmer since it was first set up. Sometimes
it would skim well, but typically it did a very poor job.
I first took a set of readings the night before I replaced
this old skimmer with my new ASM G2 skimmer. I then took readings
every 2-5 days for two weeks to see what changes occurred
in the light intensity.
Answer: This was the most surprising test result,
and it goes to show that the data you collect don't always
support your expected outcome. Over the two-week testing period
I saw no significant difference in the intensity readings
in the tank. I fully expected my cleaner water to allow better
transmission of light, but the data rejected this hypothesis.
I originally considered leaving the result of this test out
of this article, but decided to leave it in to demonstrate
how careful experimental design is needed to get meaningful
results. I should have defined what a "better" skimmer
was before the test began. For example, was a "better"
skimmer one that could produce a cup of skimmate per day versus
one cup per week? I could have also decided to assign a ranked
value for water clarity or yellow tint before the test began
and took pictures to demonstrate the change in water color
during the two-week period.
Ultimately, this test was unlikely to succeed in showing
a difference in PAR readings associated with a "better"
skimmer, mainly because I did not figure out exactly how to
fine-tune my skimmer until it had been running for over two
months. While my skimmer was producing a cup of skimmate every
day during the two-week period, it was a relatively thin skimmate
that was a light tea color instead of a dark green skimmate
that usually indicates better performance. If someone wants
to attempt this test with a new skimmer, they should first
learn how to fine-tune the skimmer on another tank before
beginning the test. This way the two-week testing period could
reflect a more accurate comparison between the old skimmer
(assumed to be fine-tuned) and the new skimmer.
It does seem logical if more dissolved organics and particulates
are removed from the water that light transmission would increase.
I would be interested in hearing what other people find if
they can replicate this process when replacing their own skimmer.
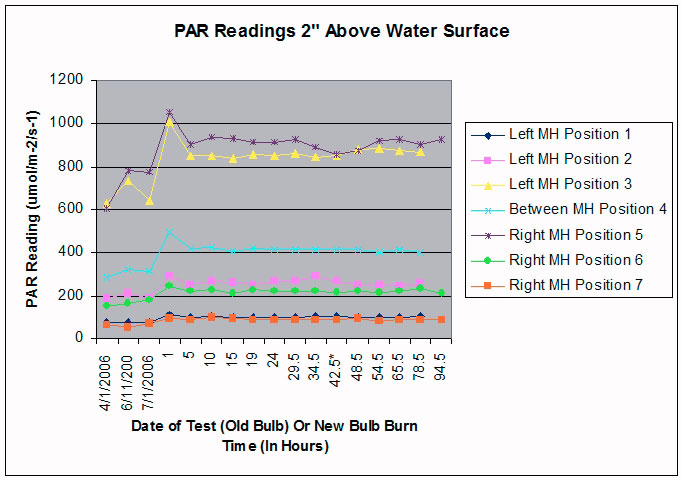
Test 8 - Question: What are the PAR values of new XM
175-watt 10000K MH bulbs during the 100-hour burn-in period?
Test Setup: I run XM 10000K 175-watt bulbs on my tank
and recently ordered replacements for my aging bulbs. I collected
data several times for the old bulbs over a period of months.
I then removed the old bulbs, put in the new bulbs and let
them run for one hour before taking readings. I frequently
see websites (Riddle 2006) and threads that say the 100-hour
burn-in period for bulbs is important as the bulbs change
in intensity and spectrum. I could not measure their spectrum,
but I was able to record their PAR intensity changes over
the 100-hour burn-in period and compare them to the intensity
from my aging bulbs. The VHO bulbs were left off for this
test; only the metal halide bulb intensities were measured.
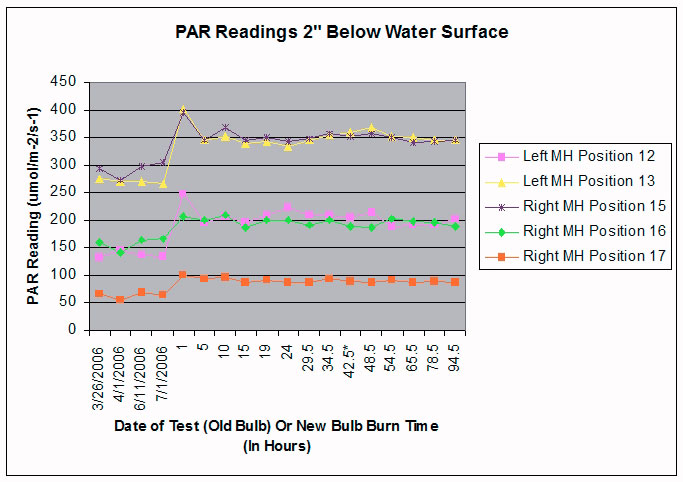
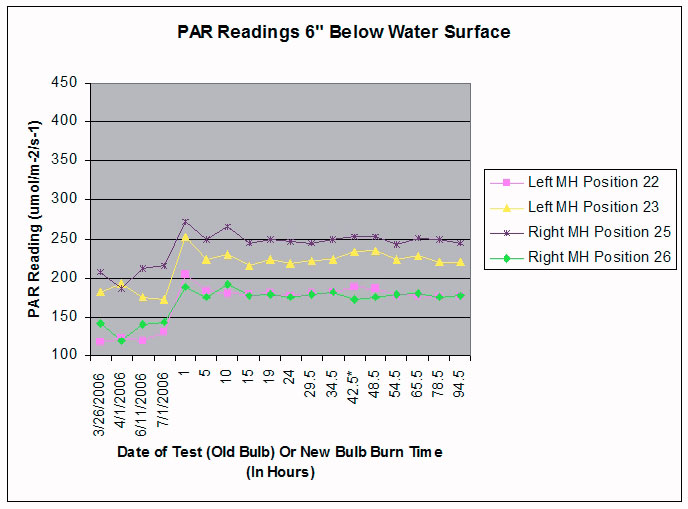
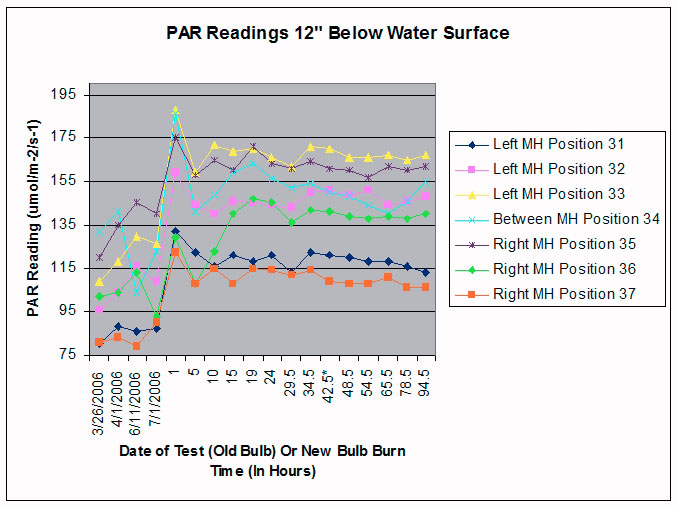
Answer: There was a dramatic increase in the intensity
of light coming from the new bulbs compared to the old bulbs
(see Graphs 5-8). While there was an initial spike and some
fluctuation in intensity, after 10 hours the PAR readings
fluctuated within a narrow range.
|
Graph 5: PAR values for MH bulbs in positions
1-7.
|
|
Graph 6: PAR values for MH bulbs in positions
12-17 (position 11 excluded).
|
|
Graph 7: PAR values for MH bulbs in positions
22-26 (positions 21, 24 and 27 excluded).
|
|
Graph 8: PAR values for MH bulbs in positions
31-37.
|
Limitations of the Study
The results of this study are limited
in several ways. First, I tested only a single type of ballast
and MH light bulb for each test. Second, these results reflect
a single tank with only a few tested equipment/practice changes.
Third, I did not have a spectral analyzer that would have
provided additional data about the differences between the
new MH bulbs and the aging bulbs.
I would like to encourage hobbyists reading this article
to consider borrowing or purchasing a quantum meter to determine
how the above questions could be answered in their own tanks.
Some of my test results demonstrate that minor changes such
as bulb positioning, cleaning and orientation can have dramatic
effects on PAR values. If a hobbyist wants to replicate a
change mentioned in this article, they are strongly encouraged
to test their tank's PAR values, as their results could be
very different from mine. Care should be taken when making
changes to lighting as it could easily lead to bleaching or
stressing of corals.
Conclusion
I now have some data on what happens
to my tank's light intensity based on some simple experiments
with a quantum meter. I hope some of these data have helped
you understand how different positions and practices can dramatically
affect the light intensity in our tanks.
I now have a baseline reading from the start of a new set
of MH and VHO bulbs. I will report back to you with Part II
of "Fun Times with a Quantum Meter" once I've been
running the new bulbs for 12-18 months, depending on when
the results warrant reporting. I hope to report several other
experiments in the future as well.
Acknowledgements:
I want to thank Nick of Nick's
Acrylic Reef for helping me with the design of the sensor
holder and for making rapid adjustments to the design after
my initial tests. I would also like to thank M.A.R.S.H. member
Garrick for his "Fun Times" comments that inspired
this article's title.
|